

The Ecology of Tijuana Estuary, California: An Estuarine Profile
The Ecology of Tijuana Estuary, California: An Estuarine Profile
The Ecology of Tijuana Estuary, California: An Estuarine Profile

You also want an ePaper? Increase the reach of your titles
YUMPU automatically turns print PDFs into web optimized ePapers that Google loves.
1979 pickleweed was significantly lower in cover than in<br />
c\1 1980 (Flood Year) 1979 (Table 26). By 1983, it had increased again<br />
w 1981<br />
and in 1984, through a major drought, it reached its<br />
3 1982 maximum cover, with 33 quadrats having 75%-<br />
t-<br />
1983<br />
100% cover <strong>of</strong> pickleweed. This species changed<br />
little in its spatial distribution until 1985 (Figure<br />
1984 (Drought Year)<br />
LC<br />
63); instead it changed in growth, a finding that is<br />
1985 consistent with earlier suggestions that pickleweed<br />
W<br />
3<br />
is a highly tolerant species capable <strong>of</strong> survival in a<br />
t- wide variety <strong>of</strong> salinity and moisture conditions<br />
(Zedler 1982b). Expansion in 1985 occurred in<br />
many areas that were previously occupied by<br />
cordgrass.<br />
5.3.2 Succulent-Dominated Marsh Responses to<br />
Drought<br />
<strong>The</strong> 1984 expanston <strong>of</strong> the monitoring program<br />
to include 115 quadrats beyond the cordgrass<br />
habitat provrded an opportunfty to compare 1974<br />
and 1984 data sets in detail and to document<br />
species that were el~minated by the 1984 drought<br />
<strong>The</strong> upper marsh was sampled for the first time in<br />
1974 using 357 quadrats (cf Zedler 1977 for<br />
detailed communtty descriptton) Additional<br />
informatton was obtatned in 58 stat~ons used for<br />
product~vity measurement in 1976 (Winfreld 1980)<br />
and 9 quadrats along one transect used for a study<br />
<strong>of</strong> annual pickleweed (Sailcornla brgelov~i) in 1975<br />
(Zedler 1975) While less extensive, these intertm<br />
censuses help to determine when compositional<br />
changes occurred Throughout our work at <strong>Tijuana</strong><br />
<strong>Estuary</strong>, we have assessed species composttion<br />
with the same cover classes and 0 25 m2 crrcular<br />
quadrats, so that data are readily comparable<br />
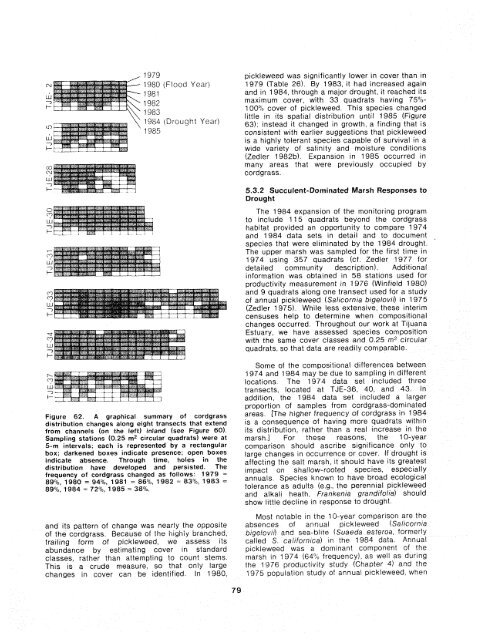
Figure 62. A graphical summary <strong>of</strong> cordgrass<br />
distribution changes along eight transects that extend<br />
from channels (on the left) inland (see Figure 60).<br />
Sampling stations (0.25 m2 circular quadrats) were at<br />
5-m intervals; each is represented by a rectangular<br />
box; darkened boxes indicate presence; open boxes<br />
indicate absence. Through time, holes in the<br />
distribution have developed and persisted. <strong>The</strong><br />
frequency <strong>of</strong> cordgrass changed as follows: 1979 =<br />
89O/o, 1980 = 94%, 1981 = 86'10, 1982 = 83%, 1983 =<br />
89%, 1984 = 72'10, 1 985 = 38%.<br />
and its pattern <strong>of</strong> change was nearly the opposite<br />
<strong>of</strong> the cordgrass. Because <strong>of</strong> the highly bianched,<br />
trailrng form <strong>of</strong> pickleweed, we assess its<br />
abundance by estimating cover in standard<br />
classes, rather than attempting to count stems<br />
This is a crude measure, so that only large<br />
changes in cover can be identified In 1980,<br />
Some <strong>of</strong> the cornposittonal differences between<br />
1974 and 1984 may be due to sampltng in different<br />
locations <strong>The</strong> 1974 data set included three<br />
transects, located at TJE-36, 40, and 43 In<br />
add~tion, the 1984 data set inciuded a larger<br />
proportion <strong>of</strong> samples from cordgrass-dominated<br />
areas. [<strong>The</strong> higher frequency <strong>of</strong> cordgrass in 1984<br />
is a consequence <strong>of</strong> having more quadrats within<br />
its distr~bution, rather than a real increase in the<br />
marsh.] For these reasons, the 10-year<br />
comparison should ascribe significance only to<br />
large changes in occurrence or cover. If drought is<br />
affecting the salt marsh, it should have its greatest<br />
impact on shallow-rooted specles, espec~ally<br />
annuals Species known to have broad ecological<br />
tolerance as adults (e.g., the perennial pickleweed<br />
and alkal~ heath, Frankenla grandlfoira) should<br />
show little decline in response to drought<br />
Most notable in the 10-year comparison are the<br />
absences <strong>of</strong> annual pickleweed (Sai/corn~a<br />
btgelovi!] aqd sea-blite (Suaeda esteroa, formerly<br />
called S cal~forn~ca) tn the 1984 data <strong>An</strong>nual<br />
pickleweed was a dominant component <strong>of</strong> the<br />
marsh tn 1974 (64O% frequency), as well as during<br />
the 1976 product~vity study (Chapter 43 and the<br />
1975 population study <strong>of</strong> annual pickleweed, when


