

The Ecology of Tijuana Estuary, California: An Estuarine Profile
The Ecology of Tijuana Estuary, California: An Estuarine Profile
The Ecology of Tijuana Estuary, California: An Estuarine Profile

Create successful ePaper yourself
Turn your PDF publications into a flip-book with our unique Google optimized e-Paper software.
Table 2Q. Standing crop (g dry wt/m2) <strong>of</strong> major salt marsh<br />
vascular plants for March (minimum biomass) 1976, 1977 and<br />
August (biomass peak) in 1976, 1977, and 1978 (from Winfield<br />
1980).<br />
Species 3/76 8/76 3/77 8/77 8/78<br />
Batis marillma<br />
saltwort 15 55 55 121 82<br />
Jaurnea carnosa a 218 66 181 195<br />
Monanthochloe littoral~s<br />
shore grass a 170 159 218 143<br />
Sal~cornia bigelovii<br />
annual p~ckleweed i 1 35 9 125 85<br />
S v~rgin~ca<br />
prckleweed 31 124 55 179 173<br />
Spart~na foliosa<br />
cordgrass 55 21 1 130 280 256<br />
Total standrng crop 426 858 514 1153 954<br />
aJaumea and shore grass were not separated In the March 1976 sarrlple<br />
there is a net flux <strong>of</strong> Inorganic nitrogen from the<br />
ttde waters to the marsh His estimate <strong>of</strong> the<br />
amount <strong>of</strong> n~trogen imported by the marsh (2 2 g<br />
N/mZ/yr) was far less than the total required for<br />
above-ground plant growth (only 28x1, and even a<br />
smaller portion <strong>of</strong> the nitrogen required for<br />
vascular-plant and algal productrvrty combined<br />
(6%) Whrle these calculations do not rule out<br />
phosphorus or other nutrients as limiting, they do<br />
show a nltrogen deficit<br />
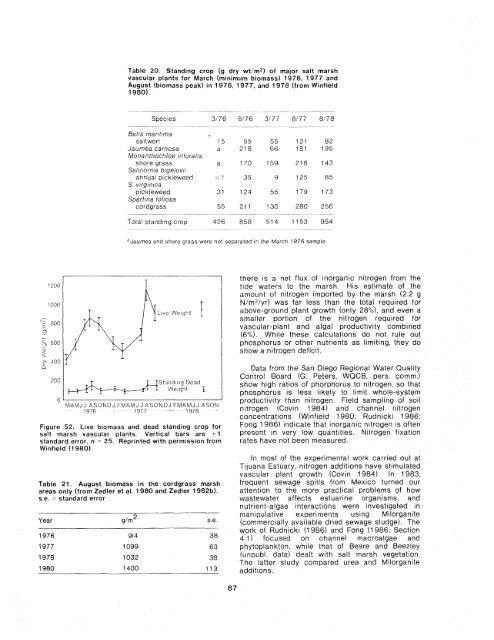
Standii-icj Dead<br />
Weiqh! I<br />
MAMJ J ASONDJ FMAMJ JASONDJ FMAMJJ ASON<br />
1976 1977 + 1978<br />
Figure 52. Live biomass and dead standing crop for<br />
salt marsh vascular plants. Vertical bars are Ll<br />
standard error, n - 25. Reprinted with permission from<br />
Winfield (1 98Q).<br />
Table 21. August biomass in the cordgrass marsh<br />
areas only (from Zedler et al. 1980 and Zedler 1982b).<br />
s.e. = standard error<br />
--<br />
Year g/m2 s e<br />
1976 914 38<br />
1977 1099 63<br />
1978 1032 38<br />
1 980 1400 113<br />
J<br />
Data from the San Dtego Regional Water Quality<br />
Control Board (G. Peters, WQCB, pers comm)<br />
show high ratios <strong>of</strong> phorphorus to nitrogen, so that<br />
phosphorus is less likely to limit whole-system<br />
productivrty than nitrogen Freld sampling <strong>of</strong> sorl<br />
nitrogen (Covin 1984) and channel nitrogen<br />
concentrattons (Winfreld 1980, Rudnickr 1986,<br />
Fong 1986) indicate that inorganic nitrogen is <strong>of</strong>ten<br />
present ~n very low quantities Nttrogen fixation<br />
rates have not been measured<br />
In most <strong>of</strong> the experimentaf work carried out at<br />
<strong>Tijuana</strong> <strong>Estuary</strong>, nttrogen additrons have stimulated<br />
vascular piant growth (Covln 1984) in 1983,<br />
frequent sewage sp~lls from Mexleo turned our<br />
attention to the more practrcal problems <strong>of</strong> how<br />
wastewater affects estuar~ne organisms, and<br />
nutrient-algae interactions were ~nvestigated In<br />
manipulative expeilments using Milorganrte<br />
(commercraily avaflable dried sewage sludge). <strong>The</strong><br />
work <strong>of</strong> Rudnicki (1 986) and Fong (1 986, Section<br />
4 11 focused on channel macroalgae and<br />
phytoplankton, whfle that <strong>of</strong> Beare and Beezley<br />
(unpubl data) dealt with salt marsh vegetation<br />
<strong>The</strong> latter study compared urea and Milorganfie<br />
additions.


