

The Ecology of Tijuana Estuary, California: An Estuarine Profile
The Ecology of Tijuana Estuary, California: An Estuarine Profile
The Ecology of Tijuana Estuary, California: An Estuarine Profile

Create successful ePaper yourself
Turn your PDF publications into a flip-book with our unique Google optimized e-Paper software.
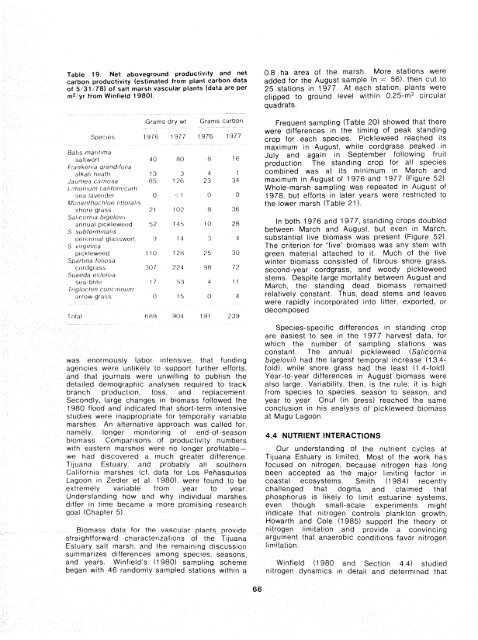
Table 19. Net aboveground productiv~ty and net<br />
carban productivity fesltmated from plant carbon data<br />
<strong>of</strong> 5/32 178) af salt marsh vascular plants (data are Per<br />
m2 yr from Wtnlreld 1980)<br />
0.8 ha area <strong>of</strong> the marsh. More stations were<br />
added for the August sample (n = 56). then cut to<br />
25 stations in 1977 At each station, plants were<br />
clipped to ground level within 0.25-m2 circular<br />
~uadrats.<br />
Grams dry wt<br />
Grdrrls carbon<br />
Frequent sampling (Table 20) showed that there<br />
were differences in the timing <strong>of</strong> peak standing<br />
crop for each species. Pickleweed reached its<br />
maximum in August, while cordgrass peaked in<br />
July and again in September following fruit<br />
production. <strong>The</strong> standing crop for all species<br />
combined was at its minimum in March and<br />
maximum in August <strong>of</strong> 1976 and 1977 (Figure 52).<br />
Whole-marsh sampling was repeated in August <strong>of</strong><br />
1978, but efforts in later years were restricted to<br />
the lower marsh (Table 21 1.<br />
$ldt!li~d f0~1~lhc~<br />
ur~$tjv %O? 2?11 3H 72<br />
?;iidOS%J t'ilfl~i,~i<br />
"%(:


