

The Ecology of Tijuana Estuary, California: An Estuarine Profile
The Ecology of Tijuana Estuary, California: An Estuarine Profile
The Ecology of Tijuana Estuary, California: An Estuarine Profile

You also want an ePaper? Increase the reach of your titles
YUMPU automatically turns print PDFs into web optimized ePapers that Google loves.
_I___ I__-~---<br />
4.4.1 Nitragen Fluxes in 1977-1 978<br />
Winfield (1980) set out to determine (1) the net<br />
direction <strong>of</strong> inorganic nitrogen movement <strong>of</strong><br />
selected tidal cycles, (2) the relative tmportance <strong>of</strong><br />
ammonium, nitrate and nitrite in channel waters,<br />
and (3) the seasonal patterns in inorganrc nitrogen<br />
flux. HIS field data included both flood and<br />
nonflood years, so that comparrsons became<br />
possible and our abil~ty to extrapolate to longer<br />
periods <strong>of</strong> time was improved.<br />
----o--<br />
--.--<br />
Flood Tidal Flow<br />
Ebb Tidal Flow<br />
A<br />
Concentrattons <strong>of</strong> inorganic n~trogen were<br />
sampled monthly in two t~dal creeks durrng the<br />
flood and ebb cycles <strong>of</strong> spring tides Water<br />
samples were analyzed for ammonlum, n~trate, and<br />
nitrite, using methods outl~ned In Strrckland and<br />
Parsons (1972). One <strong>of</strong> the tidal creeks drained an<br />
area dominated by m~xed cordgrass and<br />
p~cklsweed, and the other dralned an area<br />
dominated by succulents <strong>The</strong> two statfons did not<br />
differ In nitrogen dynamics, despite therr difference<br />
In vascular plant dominance. <strong>The</strong>refore, they were<br />
averaged to calculate nitrogen fluxes<br />
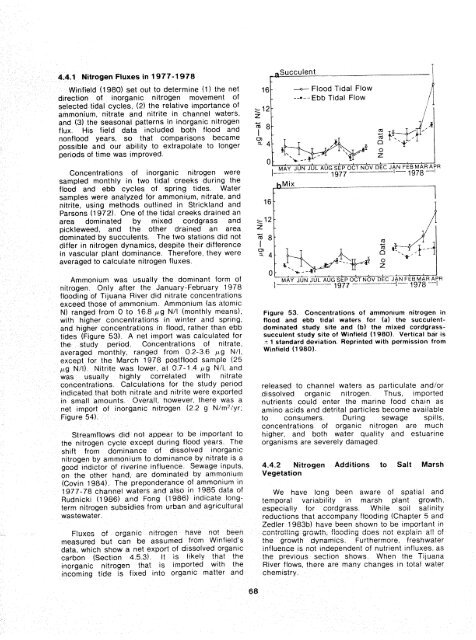
Amrnon~um was usually the domlnant form <strong>of</strong><br />
nitrogen Only after the January-February 1978<br />
flooding <strong>of</strong> <strong>Tijuana</strong> River did nltrate concentrations<br />
exceed those <strong>of</strong> arnmonfum Ammonrum (as atomrc<br />
N) ranged from O to 168 pg N/I (monthly means),<br />
with higher concentrations In winter and sprlng,<br />
and higher concentratiorls In flood, rather than ebb<br />
tides (Figure 53) A net import was calculated for<br />
tho study period Concentrat~ons <strong>of</strong> nitrate,<br />
averaged monthly, ranged from 0 2-3 6 pg N/I,<br />
except far the March 1978 postflood sample (25<br />
pg N/I) Nitr~te was lower, at 0 7-1.4 pg N/I, and<br />
was usually hrghly correlated w~th nitrate<br />
concentrations Calculatrons for the study period<br />
rrrdl~ated that both nitrate and nllrite were oxported<br />
in small amounts Overall, however, there was a<br />
net Import <strong>of</strong> inorganic nitrogen (2 2 g N/m2/yr.<br />
F~gure 54).<br />
Streamflaws d~d not appear to be important lo<br />
the nitrogen cycle except dunfig flood years <strong>The</strong><br />
shrft from domrnance <strong>of</strong> dissolved inorganic<br />
nitrogen by an,monium to dominance by n~trate IS a<br />
good indictor <strong>of</strong> rrverine influence Sewage rnputs,<br />
on the other hand, are dominated by ammonlum<br />
(Covin 1984). <strong>The</strong> preponderance <strong>of</strong> ammonium in<br />
1977-78 channel waters and also in 1985 data <strong>of</strong><br />
Rudnicki (1986) and Fong 11986) indrcate longterm<br />
nitrogen subsidles from urban and agricultural<br />
wastewater,<br />
Ftuxes <strong>of</strong> organic nitrogen have not Seen<br />
measured but can be assumed from Wrnfield's<br />
data, which show a net export <strong>of</strong> dissolved organic<br />
carbon fSect~on 45.3). ft IS likely that the<br />
inorganic nitrogen that is imported with the<br />
rncoming tide is fixed ~nto organrc matter and<br />
0<br />
Z<br />
A,.- A. -.u<br />
MAY JUN JUL AUG SEP OCT NOV REC JAN FEE MAR APR<br />
I--. -- ---- - ,977 -- -<br />
-- -1- 1978 ---I<br />
figure 53. Concentrations <strong>of</strong> ammonrum nitrogen in<br />
flood and ebb tidal waters for (a) the succulentdominated<br />
study site and (b) the mixed cordgrasssucculent<br />
study site <strong>of</strong> Winfield (1 980). Vertical bar is<br />
+ 1 standard deviation. Reprinted with permission from<br />
Winfieid (1 980).<br />
released to channel waters as partrculate and/or<br />
drssolved organtc nttrogen Thus, ~mported<br />
nutrrents could enter the marine food chaln as<br />
amino acrds and detritaf particles become available<br />
to consumers Durrng sewage sprlls,<br />
concentratrons <strong>of</strong> organtc nitrogen are much<br />
hfgher, and both water quality and estuarine<br />
organisms are severely damaged<br />
4.4.2 Nitrogen Additions to Salt Marsh<br />
Vegetation<br />
We have long been aware <strong>of</strong> spatla1 and<br />
temporal vartabifity In marsh plant growth,<br />
espectaiiy for cordgrass While soil salinity<br />
reductrons that accompany flooding (Chapter 5 and<br />
Zedler 1983) have been shown to be ~mportant in<br />
controtiing grctwth, flooding does not expiatn att <strong>of</strong><br />
the growth dynamics. Furthermore, freshwater<br />
influerrce 1s not independent <strong>of</strong> nutrient influxes, as<br />
the pfevious sectlon shows When the <strong>Tijuana</strong><br />
River flows, there are many changes in total water<br />
chemistry


