

The Ecology of Tijuana Estuary, California: An Estuarine Profile
The Ecology of Tijuana Estuary, California: An Estuarine Profile
The Ecology of Tijuana Estuary, California: An Estuarine Profile

Create successful ePaper yourself
Turn your PDF publications into a flip-book with our unique Google optimized e-Paper software.
flushing until mid-December 1984. Eight months <strong>of</strong><br />
closure had devastating effects on the estuary.<br />
While the reduction <strong>of</strong> tidal flushing is in itself a<br />
catastrophic event for a marine-dominated system,<br />
the situation was made worse by its coincidence<br />
with a year <strong>of</strong> near-zero rainfall. Channels became<br />
hypersaline (60 ppt in fall 1984; R. Rudnicki,<br />
SDSU, pers. comm.), shallow creek bottoms<br />
desiccated and turned to brick, and marsh soils<br />
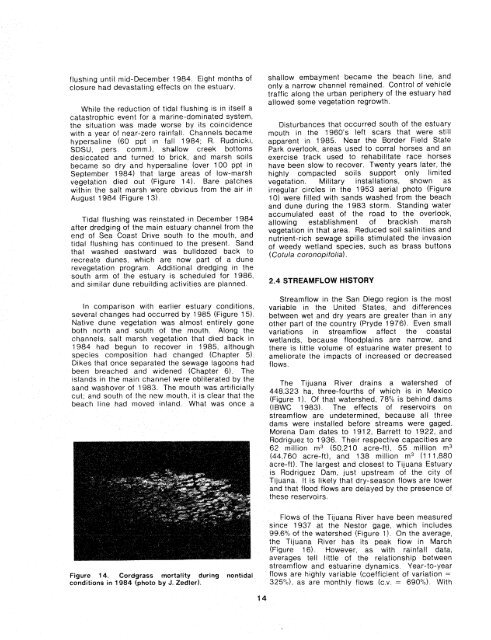
became so dry and hypersaline (over 100 ppt in<br />
September 1984) that large areas <strong>of</strong> low-marsh<br />
vegetation died out (Figure 14). Bare patches<br />
within the salt marsh were obvious from the air in<br />
August 1984 (Figure 13).<br />
Tidal flushing was re~nstated in December 1984<br />
after dredging <strong>of</strong> the main estuary channel from the<br />
end <strong>of</strong> Sea Coast Drlve south to the mouth, and<br />
tidal flushing has cont~nued to the present Sand<br />
that washed eastward was bulldozed back to<br />
recreate dunes. wh~ch are now part <strong>of</strong> a dune<br />
revegetation program Addit~onal dredg~ng In the<br />
south arm <strong>of</strong> the estuary IS scheduled for 1986,<br />
and slmllar dune rebutldrng act~v~t~es are planned<br />
shallow embayment became the beach line, and<br />
only a narrow channel remained. Control <strong>of</strong> vehicle<br />
traffic along the urban periphery <strong>of</strong> the estuary had<br />
allowed some vegetation regrowth.<br />
Disturbances that occurred south <strong>of</strong> the estuary<br />
mouth in the 1960's left scars that were still<br />
apparent in 1985. Near the Border Field State<br />
Park overlook, areas used to corral horses and an<br />
exercise track used to rehabilitate race horses<br />
have been slow to recover. Twenty years later, the<br />
highly compacted soils support only limited<br />
vegetation. Military installations, shown as<br />
irregular circles in the 1953 aerial photo (Figure<br />
10) were filled with sands washed from the beach<br />
and dune during the 1983 storm. Standing water<br />
accumulated east <strong>of</strong> the road to the overlook,<br />
allowing establishment <strong>of</strong> brackish marsh<br />
vegetation in that area. Reduced soil salinities and<br />
nutrient-rich sewage spills stimulated the invasion<br />
<strong>of</strong> weedy wetland species, such as brass buttons<br />
(Cotula coronopifolia).<br />
2.4 STREAMFLOW HISTORY<br />
In comparison w~th earl~er estuary cond~t~ons,<br />
several changes had occurred by 1985 (Figure 15)<br />
Natlve dune vegetation was almost entlrely gone<br />
both north and south <strong>of</strong> the mouth Along the<br />
channels, salt marsh vegetat~on that died back in<br />
1984 had begun to recover in 1985, although<br />
species cnrnpos~tion had changed (Chapter 5)<br />
Okes that once separated the sewage lagoons had<br />
been breached and wtdened (Chapter 6) <strong>The</strong><br />
islands In the mairl channel were obl~terated by the<br />
sand washover <strong>of</strong> 1983 <strong>The</strong> mouth was artlfrcially<br />
cut, and south <strong>of</strong> the new mouth, it is clear that the<br />
beach l~ne had moved Inland What was once a<br />
Streamflow in the San Diego region is the most<br />
variable in the United States, and differences<br />
between wet and dry years are greater than in any<br />
other part <strong>of</strong> the country (Pryde 1976). Even small<br />
variations in streamflow affect the coastal<br />
wetlands, because floodplains are narrow, and<br />
there is little volume <strong>of</strong> estuarine water present to<br />
ameliorate the impacts <strong>of</strong> increased or decreased<br />
flows.<br />
<strong>The</strong> <strong>Tijuana</strong> River drains a watershed <strong>of</strong><br />
448.323 ha, three-fourths <strong>of</strong> which is in Mexico<br />
(Figure 1). Of that watershed, 78% is behind dams<br />
(IBWC 1983). <strong>The</strong> effects <strong>of</strong> reservoirs on<br />
streamflow are undetermined, because all three<br />
dams were installed before streams were gaged.<br />
Morena Dam dates to 191 2, Barrett to 1922, and<br />
Rodr~guez to 1936 <strong>The</strong>~respective capacltles are<br />
62 mill~on m3 (50,210 acre-ft), 55 mllllon m3<br />
(44.760 acre-ft), and 138 million m3 (111,880<br />
acre-ft) <strong>The</strong> largest and closest to <strong>Tijuana</strong> <strong>Estuary</strong><br />
is Rodr~guez Dam, just upstream <strong>of</strong> the clty <strong>of</strong><br />
Tljuana It IS ltkely that dry-season flows are lower<br />
and that flood flows are delayed by the presence <strong>of</strong><br />
these resefvorrs<br />
Flows <strong>of</strong> the Trjuana Rlver have been measured<br />
slnce 1937 at the Neslor gage, whtch includes<br />
99 6% <strong>of</strong> the watershed (F~gure 11 On the average<br />
the Tljuana River has ~ts peak flow in March<br />
(Figure 16) However. as w~th ratnfall data,<br />
averases tell little <strong>of</strong> the relationshl~ between<br />
streamflow and estuar~ne dynamics Year-to-year<br />
Figure 34. Cordgrass mortality during nontidai flows are h~ghly var~able (coefficient <strong>of</strong> variatron =<br />
conditions in 1984 (photo by J. fedler).<br />
325%)- as are monthly flows (c v = 690%) With


