

The Ecology of Tijuana Estuary, California: An Estuarine Profile
The Ecology of Tijuana Estuary, California: An Estuarine Profile
The Ecology of Tijuana Estuary, California: An Estuarine Profile

Create successful ePaper yourself
Turn your PDF publications into a flip-book with our unique Google optimized e-Paper software.
. Soil salinity was again low (30 ppt) in April<br />
1983, when a long winter distributed rainfall well<br />
into spring. It is likely that the average for April<br />
overestimated salinities later in the growing<br />
season, because <strong>of</strong> major influxes <strong>of</strong> fresh water<br />
from Rodriguez Dam thrcughout the growing<br />
season (IBWC 1983) that dropped channel water<br />
salinities to zero in August (Zedler et al. 1984a).<br />
c. <strong>The</strong> September 1984 data point is the most<br />
unusual. <strong>An</strong> average soil salinity <strong>of</strong> 104 ppt in<br />
September 1984 resulted from estuarine closure in<br />
April 1984 followed by evaporation throughout the<br />
hot, dry summer. Again, this is an underestimate <strong>of</strong><br />
salinity, because several readings exceeded the<br />
0-1 50 ppt refractometer scale. Soil moisture at the<br />
end <strong>of</strong> summer was extremely low; channels were<br />
dried and cracked. <strong>The</strong> water table was 30 cm<br />
below the surface on May 31, 1984, and more than<br />
75 cm below the surface on October 9, 1984.<br />
5.2.2 Sedimentation in the Salt Marsh<br />
Elevations increased an average <strong>of</strong> 5 cm after<br />
the 1980 flood (Table 25) Most <strong>of</strong> the accretion In<br />
the marsh was due to sediment depos~t~on In<br />
addit~on, large rafts <strong>of</strong> wood and plastlc floated<br />
downstream and accumulated rn the lower marsh<br />
Later, during the 1983 winter, the estuary mouth<br />
closed br~efly and a large volume <strong>of</strong> sea water was<br />
impounded for several days Sea levels were much<br />
higher during the January f 983 storm than during<br />
previous tidal maxima (Figure 5, Cayan and Flick<br />
1985) Debr~s that had accumulated in 1980 was<br />
floated inland, pushed by the prevailing west w~nds<br />
Large rafts <strong>of</strong> wood and plastic can stile be found<br />
along the high ground to the east <strong>of</strong> the salt marsh<br />
T~juana River<br />
Table 24. Elevation (em above MSL) <strong>of</strong> quadrats<br />
included in the 1984 monitoring program. Lower<br />
marsh transects are designated cordgrass; upper<br />
marsh transects are called noncordgtass.<br />
Erevat~on Cordgrass Noncordgrass<br />
51 -60 5 1<br />
61 -70 36 7<br />
7 1 -80 4 2 3 5<br />
81 -90 2 2 4<br />
/asllb transects dominated by cordgrass ("lower<br />
marsh") n =I02 stations monitored since 1979.<br />
-<br />
transects tlorntnated by succuieo?~ ('upper<br />
marsh' ) 115 stations established in 1984.<br />
161 -4 70 1<br />
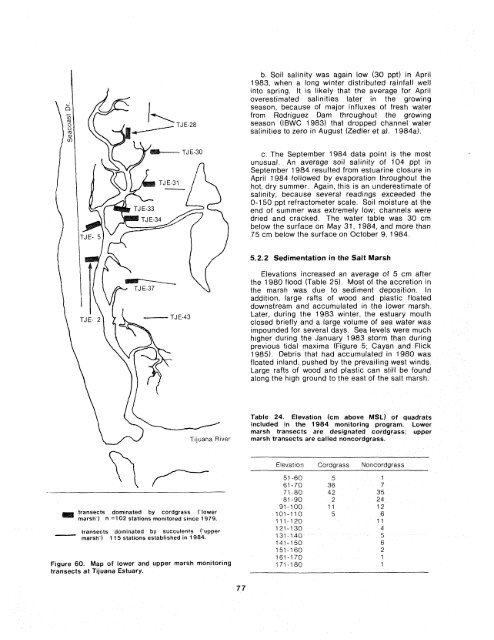
Figure 60. Map <strong>of</strong> lower and upper marsh monitoring 171-180 1<br />
transects at <strong>Tijuana</strong> <strong>Estuary</strong>. -.


