

The Ecology of Tijuana Estuary, California: An Estuarine Profile
The Ecology of Tijuana Estuary, California: An Estuarine Profile
The Ecology of Tijuana Estuary, California: An Estuarine Profile

You also want an ePaper? Increase the reach of your titles
YUMPU automatically turns print PDFs into web optimized ePapers that Google loves.
calculated from chlorophyll a measurements, so<br />
that other plankton could be estimated by<br />
subtract~on from totals Dead biomass was<br />
calculated by subtracting the live fraction from total<br />
POC. <strong>The</strong> difficult but precise analyses were<br />
necessary to quantify tidal water composition<br />
Over 1,850 samples were processed for carbon<br />
analysis in the 2-year study (Winfield 1980)<br />
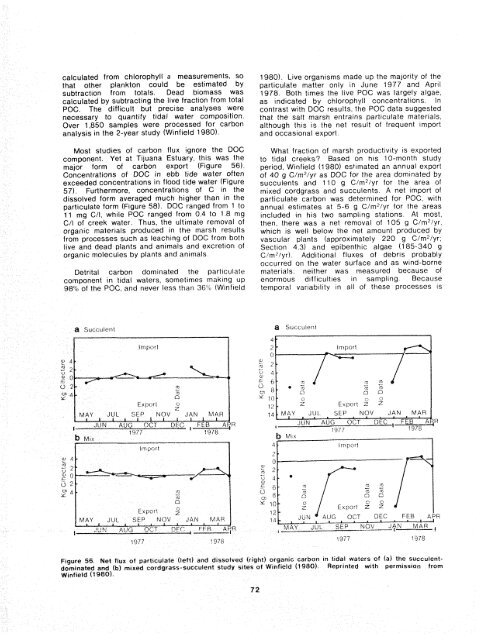
Most studles <strong>of</strong> carbon flux ignore the DOC<br />
component. Yet at <strong>Tijuana</strong> <strong>Estuary</strong>, thts was the<br />
major form <strong>of</strong> carbon export (Figure 56)<br />
Concentratrons oi DOC in ebb ttde water <strong>of</strong>ten<br />
exceeded concentrations in flood tide water (Figure<br />
57). Furthermore, concentrattons <strong>of</strong> C In the<br />
drssolved form averaged much higher than In the<br />
part~culate form (Figure 58). DOC ranged from 1 to<br />
11 mg C/I, whrle POC ranged from 04 to 1 8 mg<br />
C/I <strong>of</strong> creek water. Thus, the ultimate removal <strong>of</strong><br />
organic mater~als produced in the marsh results<br />
from processes such as leaching <strong>of</strong> DOC from both<br />
trve and dead plants and anbmals and excretion <strong>of</strong><br />
organic molecules by piants and an~mals<br />
Detrltal carbon dominated the particulate<br />
component In t~dai waters, sarnetirnes making up<br />
98% <strong>of</strong> the PQC, and never less than 3tYU (Winfield<br />
1980). Live organisms made up the majority <strong>of</strong> the<br />
particulate matter only in June 1977 and April<br />
1978. Both times the live POC was largely algae,<br />
as indicated by chlorophyll concentrations. In<br />
contrast with DOC results, the POC data suggested<br />
that the salt marsh entrains particulate materials.<br />
although this is the net result <strong>of</strong> frequent import<br />
and occasior~al export.<br />
What fraction <strong>of</strong> marsh product~vrty is exported<br />
to tidal creeks' Based on his 10-month study<br />
penod, W~nfield (1980) estimated an annual export<br />
<strong>of</strong> 40 g C/m2/yr as DOC for the area domfnated by<br />
succulents and 110 g C/m2/yr for the area <strong>of</strong><br />
mixed cordgrass and succulents A net import <strong>of</strong><br />
partlcuiate carbon was determ~ned for POC, wrth<br />
annual estimates at 5-6 g C/m2/yr for the areas<br />
included in his two sampling statrons At most,<br />
then, there was a net removal <strong>of</strong> 105 g C/m7/yr,<br />
which is well below the net amount produced by<br />
vascular plants (approximately 220 g C/m2/yr.<br />
Secttan 4 3) and eptbenthlc algae (185-340 g<br />
C/ine'/yr) Add~t~onal fluxes <strong>of</strong> debris probably<br />
occurred on the water surface and as wind-borne<br />
mater~als, ne~ther was measured because <strong>of</strong><br />
enormous difficulties in sampling Because<br />
temporal variab~lity in all <strong>of</strong> these processes IS<br />
Figure 56. Net flux <strong>of</strong> parttculate (left) and diss<strong>of</strong>ved (right! organic carbon in tidal waters <strong>of</strong> (a) the succulentdominated<br />
and fb) mtxed cordgrass-succulent study s~tes <strong>of</strong> Wtnfield (1980). Reprinted with pernissron from<br />
Winfieid (18801.


