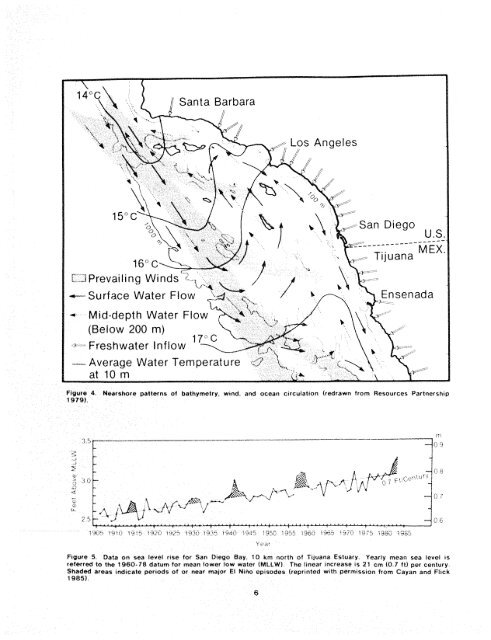
CHAPTER 2 MAJOR FACTORS THAT HAVE SHAPED THE ESTUARY 2.1 GEOLOGIC HISTORY embayments filled with sediment, and, without continilous river flow and scouring, their mouths <strong>The</strong> geologic history <strong>of</strong> <strong>Tijuana</strong> <strong>Estuary</strong> and its closed between flood seasons, adiacent coast is poorly studied. Yet it is so different from most <strong>of</strong> the Nation's estuaries that <strong>The</strong> recent geologic factors that have shaped even the most general descriptions are useful. In the estuary are thus the competing forces <strong>of</strong> rising his review <strong>of</strong> sea level and coastal morphology sea level, which promotes Inland migration <strong>of</strong> the during the late Pleistocene, Bloom (1983a,b) estuary, and tectonic upl~ft, whrch reverses that characterized the Pacific Coast as "a total contrast trend <strong>The</strong> location <strong>of</strong> the shore and the to the trailing corltinental margin with coastal conftguratlon ot the mouth are addrt~onal variables plains <strong>of</strong> the Atlantic and Gulf coasts. Active that influence the srze and cond~tion <strong>of</strong> the estuary tectonics associated with regional strike-slip Longshore drift is generally southward In southern faulting characterize the <strong>California</strong> coast." <strong>California</strong>, w~th flows interrupted by submarine canyons However, the precise patterns and As continental drift shifted North America seasonal sh~fts at <strong>Tijuana</strong> <strong>Estuary</strong> have not been toward the west, a steep coastline and narrow quaritified What is clear IS that catastrophic beach contrnental shelf developed (Figure 4) Marine terraces were gradually carved along the shores <strong>The</strong>n In the late Cenozo~c, tectonic upl~ft raised ailuvlal terraces to several hundred meters above modern sea levels, the lowest <strong>of</strong> these terraces were Iatd down 125,000 to 80,000 years ago (Ku and Kern 1974, Kern 1977. Lajoie et al 1979) In some places, the youngest terraces have been thrust 40 m above current shorelines Because the shelf has a steep decline, Pleistocene glaciation and receding sea levels did not expose large expanses <strong>of</strong> coastal land What IS now the Tljuana Rlver presumably cut through these terraces, although the narrow fioodplaln suggests that flows were not consrstently large <strong>The</strong> cut that frames <strong>Tijuana</strong> <strong>Estuary</strong> IS only a few kilometers wide <strong>The</strong> plcture emerges <strong>of</strong> a sharp. steeply inclined coast with vertically acttve terraces <strong>The</strong>n, In the Holocene, a rising sea began to reclarm the exposed margins <strong>of</strong> the coastal shelf As Bloorn (I%$%) gftes on :o say. "the !ast 15.05?0 years <strong>of</strong> Californ~a coastal evolution have been dtjmrnated by submergence coincident with deglaciation' <strong>The</strong> rivers were drowned and lagoons formed as longshore drift created sandy barrrers along the coast W~th flooding most <strong>of</strong> the coastal eroslon has shifted the sllorel~ne landward in the past few years How much <strong>of</strong> that shift is due to recent storms and how much IS a general trend due to rrsir-ig sea level are yet to be determined <strong>The</strong> recent htstory <strong>of</strong> sea level rlse has been sumrnarized by Flick and Cayan (1984) and Cayan and Flick (1985) Data from 1906 to the present. taken in San Dfego Bay, indicate an average rise <strong>of</strong> about 20 cm/century (Figure 5) Dur~ng recurrent El Nino events, the rate <strong>of</strong> sea level rise has been even higher <strong>The</strong> hlghest sea level on record occurred in January 1983, when predicted sea levels were exceeded by 26 cm due to the coincidence <strong>of</strong> El Nino, high spring tides, and a major sea storm Still, the water levels might have been even higher if these three events had also coincided with the hlghest pornt In the 19-year tidal cycle (Cayan and Ftick 1985) <strong>The</strong> future locatlon and configuration <strong>of</strong> the shorelrne will depend on both the chron~c and catastrophic increases In sea level While the former will shlft estuarine habitats ~nland the latter will lap away at the marlne margins <strong>The</strong> 1904 map <strong>of</strong> <strong>Tijuana</strong> <strong>Estuary</strong> (Figure 6) prov~des the earliest indication <strong>of</strong> hiStOrlC cond~tions Three features that are clearly mapped are not evident in later photographs F~rst, there IS
FI(I(uPc$ 4. Wei&rahOt@ patt@rns <strong>of</strong> b#t)Pymghlry, wmd, and aceJan ctrc~laflon (rfKIrawn fr~m Re$our~es Partnershlp rats!. Figure I Date an sea ievet rise for %en Ds~go &ray, 1Q km nurth <strong>of</strong> f~iuana <strong>Estuary</strong>. Yearly mean sea level 15 ~elerrd to tho 5960-78 datum tor moan loww [low water (IWLLWI <strong>The</strong> ltnser rncreaoe ts 21 em (0.7 ft) per century Shad& areas tadrcats periods <strong>of</strong> or near major Ef Nlrlo episodes (repr~nted Wgth permtssion from Gayan and Flrck r ass) e
- Page 1 and 2: June 1986 I THE ECOLOGY OF TIJUANA
- Page 3 and 4: The findings in this report are not
- Page 5 and 6: CONVERSION TABLE Metric to U.S. Cus
- Page 7 and 8: Page 4.5 Energy Flow ..............
- Page 9 and 10: Number Page The channel fish cornrn
- Page 11 and 12: ACKNOWLEDGMENTS The California Sea
- Page 13 and 14: Figure 1. Lacatlcrn of 71juana Estu
- Page 15: Figure 3. Map6 of Tijuana Estuary s
- Page 19 and 20: also limitrng Hot, dry desert winds
- Page 21 and 22: 2.3 LAND USE HlSPQWV Through exami!
- Page 23 and 24: The nearby bridge remained, and ext
- Page 25 and 26: flushing until mid-December 1984. E
- Page 27 and 28: with seawater. Even in years with s
- Page 29 and 30: flats ~n winter but not in midsumme
- Page 31 and 32: Each "island" of higher topography
- Page 33 and 34: The vegetation and soils of the upp
- Page 35 and 36: populations (Massey 1979) The brrds
- Page 37 and 38: c~n~entrations of insects, especial
- Page 39 and 40: Frgufe 29. The Ifght-footed clapper
- Page 41 and 42: Figure 30. During winter (above) th
- Page 43 and 44: anlmal footprints, In the hardpan f
- Page 45 and 46: Tijuana Estuary salt marsh Such exp
- Page 47 and 48: Frgura 36 The etraracrel an& tidal
- Page 49 and 50: ^_ _I __"___I _-a_. -- fable 7. Inv
- Page 51 and 52: Pre- 1980 (excluding Hosrner Rehse
- Page 53 and 54: Table 8. Average density (number/m2
- Page 55 and 56: changes in envlronment has not been
- Page 57 and 58: was dominated by goby species, Cali
- Page 59 and 60: compared the ,chthyoplankton commun
- Page 61 and 62: Figure 43, Birds of the intertidal
- Page 63 and 64: -" and that the community was compo
- Page 65 and 66: Willet (1 73) i - Water Depth (cm)
- Page 67 and 68:
Table 14. Early information on dune
- Page 69 and 70:
Figure 48. Birds that nest on the s
- Page 71 and 72:
CHAPTER 4 ECOSYSTEM FldNCTlONlNG St
- Page 73 and 74:
were no? irght-saturated untri expo
- Page 75 and 76:
Table 17. Conceptual model of chann
- Page 77 and 78:
Table 19. Net aboveground productiv
- Page 79 and 80:
_I___ I__-~--- 4.4.1 Nitragen Fluxe
- Page 81 and 82:
i i t 1 1 I Table 22. Standing crop
- Page 83 and 84:
calculated from chlorophyll a measu
- Page 85 and 86:
Dissolved Organic Biomass Carbon De
- Page 87 and 88:
CHAPTER 5 THE ROLE OF DISTURBANCES
- Page 89 and 90:
Table 25. Changes in elevation in t
- Page 91 and 92:
Table 26. Change in pickleweed cano
- Page 93 and 94:
Table 27. Occurrence (in circular 0
- Page 95 and 96:
perennials can survive long periods
- Page 97 and 98:
An experiment was designed to deter
- Page 99 and 100:
CHAPTER 6 MANAGEMENT CONSIDERATIONS
- Page 101 and 102:
Closely associated with the researc
- Page 103 and 104:
c. Dredging at Tijuana Estuary will
- Page 105 and 106:
Table 30. Predicted impacts of redu
- Page 107 and 108:
footed clapper rails; the picklewee
- Page 109 and 110:
overwashas, and slabiiizatran rs rl
- Page 112 and 113:
REFERENCES Allen, L.G. 1980. Struct
- Page 114 and 115:
Minsky, D. 1984. California least t
- Page 116:
30272 -101 REPORT WUMENTATION 1. RE