1979 pickleweed was significantly lower in cover than in c\1 1980 (Flood Year) 1979 (Table 26). By 1983, it had increased again w 1981 and in 1984, through a major drought, it reached its 3 1982 maximum cover, with 33 quadrats having 75%- t- 1983 100% cover <strong>of</strong> pickleweed. This species changed little in its spatial distribution until 1985 (Figure 1984 (Drought Year) LC 63); instead it changed in growth, a finding that is 1985 consistent with earlier suggestions that pickleweed W 3 is a highly tolerant species capable <strong>of</strong> survival in a t- wide variety <strong>of</strong> salinity and moisture conditions (Zedler 1982b). Expansion in 1985 occurred in many areas that were previously occupied by cordgrass. 5.3.2 Succulent-Dominated Marsh Responses to Drought <strong>The</strong> 1984 expanston <strong>of</strong> the monitoring program to include 115 quadrats beyond the cordgrass habitat provrded an opportunfty to compare 1974 and 1984 data sets in detail and to document species that were el~minated by the 1984 drought <strong>The</strong> upper marsh was sampled for the first time in 1974 using 357 quadrats (cf Zedler 1977 for detailed communtty descriptton) Additional informatton was obtatned in 58 stat~ons used for product~vity measurement in 1976 (Winfreld 1980) and 9 quadrats along one transect used for a study <strong>of</strong> annual pickleweed (Sailcornla brgelov~i) in 1975 (Zedler 1975) While less extensive, these intertm censuses help to determine when compositional changes occurred Throughout our work at <strong>Tijuana</strong> <strong>Estuary</strong>, we have assessed species composttion with the same cover classes and 0 25 m2 crrcular quadrats, so that data are readily comparable Figure 62. A graphical summary <strong>of</strong> cordgrass distribution changes along eight transects that extend from channels (on the left) inland (see Figure 60). Sampling stations (0.25 m2 circular quadrats) were at 5-m intervals; each is represented by a rectangular box; darkened boxes indicate presence; open boxes indicate absence. Through time, holes in the distribution have developed and persisted. <strong>The</strong> frequency <strong>of</strong> cordgrass changed as follows: 1979 = 89O/o, 1980 = 94%, 1981 = 86'10, 1982 = 83%, 1983 = 89%, 1984 = 72'10, 1 985 = 38%. and its pattern <strong>of</strong> change was nearly the opposite <strong>of</strong> the cordgrass. Because <strong>of</strong> the highly bianched, trailrng form <strong>of</strong> pickleweed, we assess its abundance by estimating cover in standard classes, rather than attempting to count stems This is a crude measure, so that only large changes in cover can be identified In 1980, Some <strong>of</strong> the cornposittonal differences between 1974 and 1984 may be due to sampltng in different locations <strong>The</strong> 1974 data set included three transects, located at TJE-36, 40, and 43 In add~tion, the 1984 data set inciuded a larger proportion <strong>of</strong> samples from cordgrass-dominated areas. [<strong>The</strong> higher frequency <strong>of</strong> cordgrass in 1984 is a consequence <strong>of</strong> having more quadrats within its distr~bution, rather than a real increase in the marsh.] For these reasons, the 10-year comparison should ascribe significance only to large changes in occurrence or cover. If drought is affecting the salt marsh, it should have its greatest impact on shallow-rooted specles, espec~ally annuals Species known to have broad ecological tolerance as adults (e.g., the perennial pickleweed and alkal~ heath, Frankenla grandlfoira) should show little decline in response to drought Most notable in the 10-year comparison are the absences <strong>of</strong> annual pickleweed (Sai/corn~a btgelovi!] aqd sea-blite (Suaeda esteroa, formerly called S cal~forn~ca) tn the 1984 data <strong>An</strong>nual pickleweed was a dominant component <strong>of</strong> the marsh tn 1974 (64O% frequency), as well as during the 1976 product~vity study (Chapter 43 and the 1975 population study <strong>of</strong> annual pickleweed, when
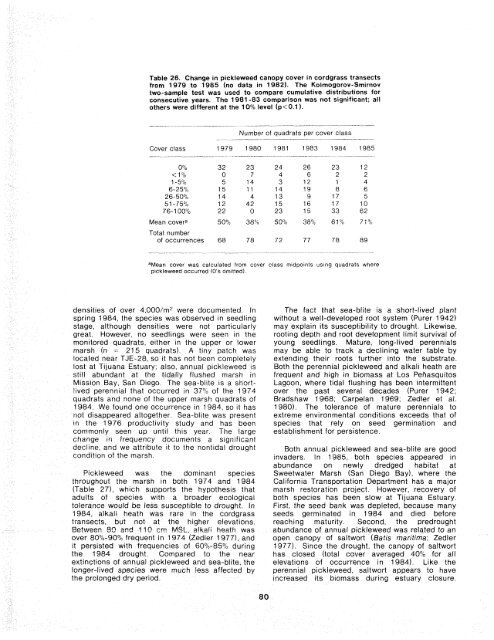
Table 26. Change in pickleweed canopy cover in cordgrass transects from 1979 to 1985 (no data in 1982). <strong>The</strong> Kolmogorov-Smirnov two-sample test was used to compare cumulative distributions for consecutive years. <strong>The</strong> 1981 -83 comparison was not significant; all others were different at the 10% level (p
- Page 1 and 2:
June 1986 I THE ECOLOGY OF TIJUANA
- Page 3 and 4:
The findings in this report are not
- Page 5 and 6:
CONVERSION TABLE Metric to U.S. Cus
- Page 7 and 8:
Page 4.5 Energy Flow ..............
- Page 9 and 10:
Number Page The channel fish cornrn
- Page 11 and 12:
ACKNOWLEDGMENTS The California Sea
- Page 13 and 14:
Figure 1. Lacatlcrn of 71juana Estu
- Page 15 and 16:
Figure 3. Map6 of Tijuana Estuary s
- Page 17 and 18:
FI(I(uPc$ 4. Wei&rahOt@ patt@rns of
- Page 19 and 20:
also limitrng Hot, dry desert winds
- Page 21 and 22:
2.3 LAND USE HlSPQWV Through exami!
- Page 23 and 24:
The nearby bridge remained, and ext
- Page 25 and 26:
flushing until mid-December 1984. E
- Page 27 and 28:
with seawater. Even in years with s
- Page 29 and 30:
flats ~n winter but not in midsumme
- Page 31 and 32:
Each "island" of higher topography
- Page 33 and 34:
The vegetation and soils of the upp
- Page 35 and 36:
populations (Massey 1979) The brrds
- Page 37 and 38:
c~n~entrations of insects, especial
- Page 39 and 40: Frgufe 29. The Ifght-footed clapper
- Page 41 and 42: Figure 30. During winter (above) th
- Page 43 and 44: anlmal footprints, In the hardpan f
- Page 45 and 46: Tijuana Estuary salt marsh Such exp
- Page 47 and 48: Frgura 36 The etraracrel an& tidal
- Page 49 and 50: ^_ _I __"___I _-a_. -- fable 7. Inv
- Page 51 and 52: Pre- 1980 (excluding Hosrner Rehse
- Page 53 and 54: Table 8. Average density (number/m2
- Page 55 and 56: changes in envlronment has not been
- Page 57 and 58: was dominated by goby species, Cali
- Page 59 and 60: compared the ,chthyoplankton commun
- Page 61 and 62: Figure 43, Birds of the intertidal
- Page 63 and 64: -" and that the community was compo
- Page 65 and 66: Willet (1 73) i - Water Depth (cm)
- Page 67 and 68: Table 14. Early information on dune
- Page 69 and 70: Figure 48. Birds that nest on the s
- Page 71 and 72: CHAPTER 4 ECOSYSTEM FldNCTlONlNG St
- Page 73 and 74: were no? irght-saturated untri expo
- Page 75 and 76: Table 17. Conceptual model of chann
- Page 77 and 78: Table 19. Net aboveground productiv
- Page 79 and 80: _I___ I__-~--- 4.4.1 Nitragen Fluxe
- Page 81 and 82: i i t 1 1 I Table 22. Standing crop
- Page 83 and 84: calculated from chlorophyll a measu
- Page 85 and 86: Dissolved Organic Biomass Carbon De
- Page 87 and 88: CHAPTER 5 THE ROLE OF DISTURBANCES
- Page 89: Table 25. Changes in elevation in t
- Page 93 and 94: Table 27. Occurrence (in circular 0
- Page 95 and 96: perennials can survive long periods
- Page 97 and 98: An experiment was designed to deter
- Page 99 and 100: CHAPTER 6 MANAGEMENT CONSIDERATIONS
- Page 101 and 102: Closely associated with the researc
- Page 103 and 104: c. Dredging at Tijuana Estuary will
- Page 105 and 106: Table 30. Predicted impacts of redu
- Page 107 and 108: footed clapper rails; the picklewee
- Page 109 and 110: overwashas, and slabiiizatran rs rl
- Page 112 and 113: REFERENCES Allen, L.G. 1980. Struct
- Page 114 and 115: Minsky, D. 1984. California least t
- Page 116: 30272 -101 REPORT WUMENTATION 1. RE