City of Methuen Master Plan
City of Methuen Master Plan
City of Methuen Master Plan

Create successful ePaper yourself
Turn your PDF publications into a flip-book with our unique Google optimized e-Paper software.
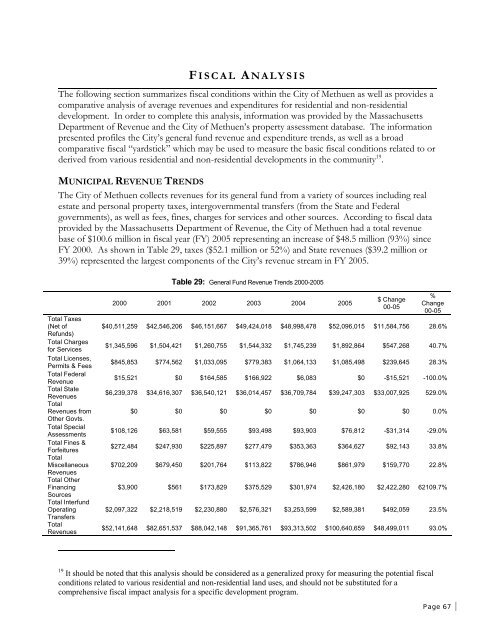
F ISCAL A NALYSIS<br />
The following section summarizes fiscal conditions within the <strong>City</strong> <strong>of</strong> <strong>Methuen</strong> as well as provides a<br />
comparative analysis <strong>of</strong> average revenues and expenditures for residential and non-residential<br />
development. In order to complete this analysis, information was provided by the Massachusetts<br />
Department <strong>of</strong> Revenue and the <strong>City</strong> <strong>of</strong> <strong>Methuen</strong>’s property assessment database. The information<br />
presented pr<strong>of</strong>iles the <strong>City</strong>’s general fund revenue and expenditure trends, as well as a broad<br />
comparative fiscal “yardstick” which may be used to measure the basic fiscal conditions related to or<br />
derived from various residential and non-residential developments in the community 19 .<br />
MUNICIPAL REVENUE TRENDS<br />
The <strong>City</strong> <strong>of</strong> <strong>Methuen</strong> collects revenues for its general fund from a variety <strong>of</strong> sources including real<br />
estate and personal property taxes, intergovernmental transfers (from the State and Federal<br />
governments), as well as fees, fines, charges for services and other sources. According to fiscal data<br />
provided by the Massachusetts Department <strong>of</strong> Revenue, the <strong>City</strong> <strong>of</strong> <strong>Methuen</strong> had a total revenue<br />
base <strong>of</strong> $100.6 million in fiscal year (FY) 2005 representing an increase <strong>of</strong> $48.5 million (93%) since<br />
FY 2000. As shown in Table 29, taxes ($52.1 million or 52%) and State revenues ($39.2 million or<br />
39%) represented the largest components <strong>of</strong> the <strong>City</strong>’s revenue stream in FY 2005.<br />
Table 29: General Fund Revenue Trends 2000-2005<br />
Total Taxes<br />
(Net <strong>of</strong><br />
Refunds)<br />
Total Charges<br />
for Services<br />
Total Licenses,<br />
Permits & Fees<br />
Total Federal<br />
Revenue<br />
Total State<br />
Revenues<br />
Total<br />
Revenues from<br />
Other Govts.<br />
Total Special<br />
Assessments<br />
Total Fines &<br />
Forfeitures<br />
Total<br />
Miscellaneous<br />
Revenues<br />
Total Other<br />
Financing<br />
Sources<br />
Total Interfund<br />
Operating<br />
Transfers<br />
Total<br />
Revenues<br />
2000 2001 2002 2003 2004 2005<br />
$ Change<br />
00-05<br />
%<br />
Change<br />
00-05<br />
$40,511,259 $42,546,206 $46,151,667 $49,424,018 $48,998,478 $52,096,015 $11,584,756 28.6%<br />
$1,345,596 $1,504,421 $1,260,755 $1,544,332 $1,745,239 $1,892,864 $547,268 40.7%<br />
$845,853 $774,562 $1,033,095 $779,383 $1,064,133 $1,085,498 $239,645 28.3%<br />
$15,521 $0 $164,585 $166,922 $6,083 $0 -$15,521 -100.0%<br />
$6,239,378 $34,616,307 $36,540,121 $36,014,457 $36,709,784 $39,247,303 $33,007,925 529.0%<br />
$0 $0 $0 $0 $0 $0 $0 0.0%<br />
$108,126 $63,581 $59,555 $93,498 $93,903 $76,812 -$31,314 -29.0%<br />
$272,484 $247,930 $225,897 $277,479 $353,363 $364,627 $92,143 33.8%<br />
$702,209 $679,450 $201,764 $113,822 $786,946 $861,979 $159,770 22.8%<br />
$3,900 $561 $173,829 $375,529 $301,974 $2,426,180 $2,422,280 62109.7%<br />
$2,097,322 $2,218,519 $2,230,880 $2,576,321 $3,253,599 $2,589,381 $492,059 23.5%<br />
$52,141,648 $82,651,537 $88,042,148 $91,365,761 $93,313,502 $100,640,659 $48,499,011 93.0%<br />
19 It should be noted that this analysis should be considered as a generalized proxy for measuring the potential fiscal<br />
conditions related to various residential and non-residential land uses, and should not be substituted for a<br />
comprehensive fiscal impact analysis for a specific development program.<br />
Page 67