City of Methuen Master Plan
City of Methuen Master Plan
City of Methuen Master Plan

You also want an ePaper? Increase the reach of your titles
YUMPU automatically turns print PDFs into web optimized ePapers that Google loves.
<strong>Methuen</strong> <strong>Master</strong> <strong>Plan</strong> 2007<br />
Source: Massachusetts Department <strong>of</strong> Revenue<br />
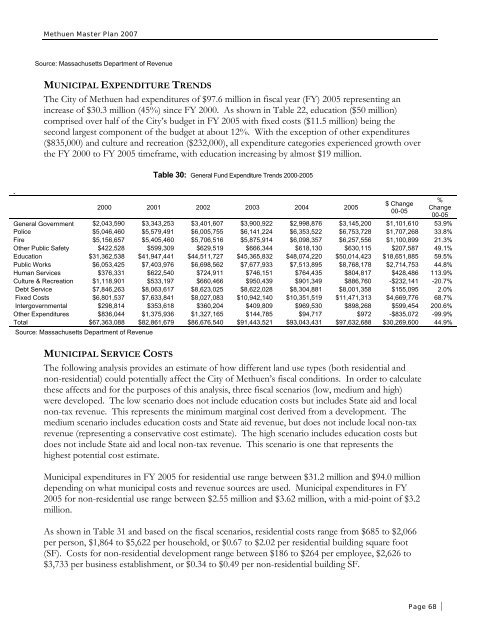
MUNICIPAL EXPENDITURE TRENDS<br />
The <strong>City</strong> <strong>of</strong> <strong>Methuen</strong> had expenditures <strong>of</strong> $97.6 million in fiscal year (FY) 2005 representing an<br />
increase <strong>of</strong> $30.3 million (45%) since FY 2000. As shown in Table 22, education ($50 million)<br />
comprised over half <strong>of</strong> the <strong>City</strong>’s budget in FY 2005 with fixed costs ($11.5 million) being the<br />
second largest component <strong>of</strong> the budget at about 12%. With the exception <strong>of</strong> other expenditures<br />
($835,000) and culture and recreation ($232,000), all expenditure categories experienced growth over<br />
the FY 2000 to FY 2005 timeframe, with education increasing by almost $19 million.<br />
.<br />
Table 30: General Fund Expenditure Trends 2000-2005<br />
2000 2001 2002 2003 2004 2005<br />
$ Change<br />
00-05<br />
%<br />
Change<br />
00-05<br />
General Government $2,043,590 $3,343,253 $3,401,607 $3,900,922 $2,998,876 $3,145,200 $1,101,610 53.9%<br />
Police $5,046,460 $5,579,491 $6,005,755 $6,141,224 $6,353,522 $6,753,728 $1,707,268 33.8%<br />
Fire $5,156,657 $5,405,460 $5,706,516 $5,875,914 $6,098,357 $6,257,556 $1,100,899 21.3%<br />
Other Public Safety $422,528 $599,309 $629,519 $666,344 $618,130 $630,115 $207,587 49.1%<br />
Education $31,362,538 $41,947,441 $44,511,727 $45,365,832 $48,074,220 $50,014,423 $18,651,885 59.5%<br />
Public Works $6,053,425 $7,403,976 $6,698,562 $7,677,933 $7,513,895 $8,768,178 $2,714,753 44.8%<br />
Human Services $376,331 $622,540 $724,911 $746,151 $764,435 $804,817 $428,486 113.9%<br />
Culture & Recreation $1,118,901 $533,197 $660,466 $950,439 $901,349 $886,760 -$232,141 -20.7%<br />
Debt Service $7,846,263 $8,063,617 $8,623,025 $8,622,028 $8,304,881 $8,001,358 $155,095 2.0%<br />
Fixed Costs $6,801,537 $7,633,841 $8,027,083 $10,942,140 $10,351,519 $11,471,313 $4,669,776 68.7%<br />
Intergovernmental $298,814 $353,618 $360,204 $409,809 $969,530 $898,268 $599,454 200.6%<br />
Other Expenditures $836,044 $1,375,936 $1,327,165 $144,785 $94,717 $972 -$835,072 -99.9%<br />
Total $67,363,088 $82,861,679 $86,676,540 $91,443,521 $93,043,431 $97,632,688 $30,269,600 44.9%<br />
Source: Massachusetts Department <strong>of</strong> Revenue<br />
MUNICIPAL SERVICE COSTS<br />
The following analysis provides an estimate <strong>of</strong> how different land use types (both residential and<br />
non-residential) could potentially affect the <strong>City</strong> <strong>of</strong> <strong>Methuen</strong>’s fiscal conditions. In order to calculate<br />
these affects and for the purposes <strong>of</strong> this analysis, three fiscal scenarios (low, medium and high)<br />
were developed. The low scenario does not include education costs but includes State aid and local<br />
non-tax revenue. This represents the minimum marginal cost derived from a development. The<br />
medium scenario includes education costs and State aid revenue, but does not include local non-tax<br />
revenue (representing a conservative cost estimate). The high scenario includes education costs but<br />
does not include State aid and local non-tax revenue. This scenario is one that represents the<br />
highest potential cost estimate.<br />
Municipal expenditures in FY 2005 for residential use range between $31.2 million and $94.0 million<br />
depending on what municipal costs and revenue sources are used. Municipal expenditures in FY<br />
2005 for non-residential use range between $2.55 million and $3.62 million, with a mid-point <strong>of</strong> $3.2<br />
million.<br />
As shown in Table 31 and based on the fiscal scenarios, residential costs range from $685 to $2,066<br />
per person, $1,864 to $5,622 per household, or $0.67 to $2.02 per residential building square foot<br />
(SF). Costs for non-residential development range between $186 to $264 per employee, $2,626 to<br />
$3,733 per business establishment, or $0.34 to $0.49 per non-residential building SF.<br />
Page 68