City of Methuen Master Plan
City of Methuen Master Plan
City of Methuen Master Plan

Create successful ePaper yourself
Turn your PDF publications into a flip-book with our unique Google optimized e-Paper software.
<strong>Methuen</strong> <strong>Master</strong> <strong>Plan</strong> 2007<br />
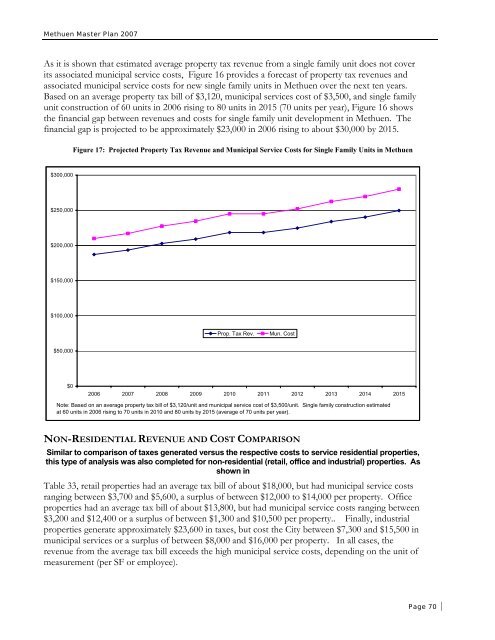
As it is shown that estimated average property tax revenue from a single family unit does not cover<br />
its associated municipal service costs, Figure 16 provides a forecast <strong>of</strong> property tax revenues and<br />
associated municipal service costs for new single family units in <strong>Methuen</strong> over the next ten years.<br />
Based on an average property tax bill <strong>of</strong> $3,120, municipal services cost <strong>of</strong> $3,500, and single family<br />
unit construction <strong>of</strong> 60 units in 2006 rising to 80 units in 2015 (70 units per year), Figure 16 shows<br />
the financial gap between revenues and costs for single family unit development in <strong>Methuen</strong>. The<br />
financial gap is projected to be approximately $23,000 in 2006 rising to about $30,000 by 2015.<br />
Figure 17: Projected Property Tax Revenue and Municipal Service Costs for Single Family Units in <strong>Methuen</strong><br />
$300,000<br />
$250,000<br />
$200,000<br />
$150,000<br />
$100,000<br />
Prop. Tax Rev.<br />
Mun. Cost<br />
$50,000<br />
$0<br />
2006 2007 2008 2009 2010 2011 2012 2013 2014 2015<br />
Note: Based on an average property tax bill <strong>of</strong> $3,120/unit and municipal service cost <strong>of</strong> $3,500/unit. Single family construction estimated<br />
at 60 units in 2006 rising to 70 units in 2010 and 80 units by 2015 (average <strong>of</strong> 70 units per year).<br />
NON-RESIDENTIAL REVENUE AND COST COMPARISON<br />
Similar to comparison <strong>of</strong> taxes generated versus the respective costs to service residential properties,<br />
this type <strong>of</strong> analysis was also completed for non-residential (retail, <strong>of</strong>fice and industrial) properties. As<br />
shown in<br />
Table 33, retail properties had an average tax bill <strong>of</strong> about $18,000, but had municipal service costs<br />
ranging between $3,700 and $5,600, a surplus <strong>of</strong> between $12,000 to $14,000 per property. Office<br />
properties had an average tax bill <strong>of</strong> about $13,800, but had municipal service costs ranging between<br />
$3,200 and $12,400 or a surplus <strong>of</strong> between $1,300 and $10,500 per property.. Finally, industrial<br />
properties generate approximately $23,600 in taxes, but cost the <strong>City</strong> between $7,300 and $15,500 in<br />
municipal services or a surplus <strong>of</strong> between $8,000 and $16,000 per property. In all cases, the<br />
revenue from the average tax bill exceeds the high municipal service costs, depending on the unit <strong>of</strong><br />
measurement (per SF or employee).<br />
Page 70