Vol 21 No. 1
Vol 21 No. 1
Vol 21 No. 1

You also want an ePaper? Increase the reach of your titles
YUMPU automatically turns print PDFs into web optimized ePapers that Google loves.
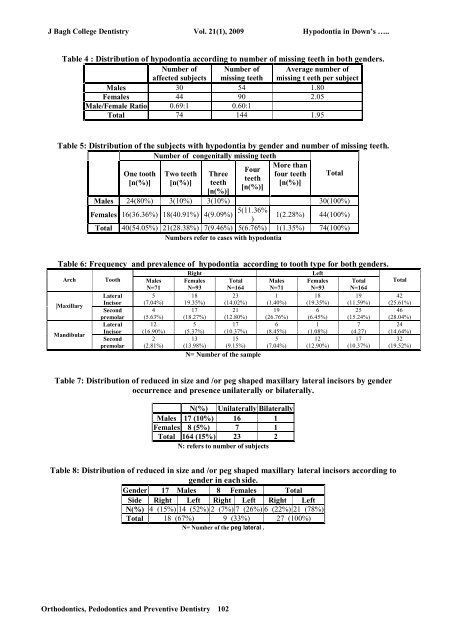
J Bagh College Dentistry <strong>Vol</strong>. <strong>21</strong>(1), 2009 Hypodontia in Down’s …..<br />
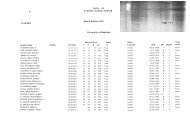
Table 4 : Distribution of hypodontia according to number of missing teeth in both genders.<br />
Number of<br />
affected subjects<br />
Number of<br />
missing teeth<br />
Average number of<br />
missing t eeth per subject<br />
Males 30 54 1.80<br />
Females 44 90 2.05<br />
Male/Female Ratio 0.69:1 0.60:1<br />
Total 74 144 1.95<br />
Table 5: Distribution of the subjects with hypodontia by gender and number of missing teeth.<br />
Number of congenitally missing teeth<br />
More than<br />
Four<br />
One tooth Two teeth Three<br />
four teeth Total<br />
teeth<br />
[n(%)] [n(%)] teeth<br />
[n(%)]<br />
[n(%)]<br />
[n(%)]<br />
Males 24(80%) 3(10%) 3(10%) 30(100%)<br />
Females 16(36.36%) 18(40.91%) 4(9.09%) 5(11.36% 1(2.28%) 44(100%)<br />
)<br />
Total 40(54.05%) <strong>21</strong>(28.38%) 7(9.46%) 5(6.76%) 1(1.35%) 74(100%)<br />
Numbers refer to cases with hypodontia<br />
Table 6: Frequency and prevalence of hypodontia according to tooth type for both genders.<br />
Arch Tooth Males<br />
N=71<br />
Lateral 5<br />
|Maxillary<br />
Incisor (7.04%)<br />
Second<br />
4<br />
premolar (5.63%)<br />
Lateral 12<br />
Mandibular<br />
Incisor (16.90%)<br />
Second<br />
2<br />
premolar (2.81%)<br />
Right<br />
Females Total<br />
N=93 N=164<br />
18<br />
23<br />
19.35%) (14.02%)<br />
17<br />
<strong>21</strong><br />
(18.27%) (12.80%)<br />
5<br />
17<br />
(5.37%) (10.37%)<br />
13<br />
15<br />
(13.98%) (9.15%)<br />
N= Number of the sample<br />
Males<br />
N=71<br />
1<br />
(1.40%)<br />
19<br />
(26.76%)<br />
6<br />
(8.45%)<br />
5<br />
(7.04%)<br />
Left<br />
Females<br />
N=93<br />
18<br />
(19.35%)<br />
6<br />
(6.45%)<br />
1<br />
(1.08%)<br />
12<br />
(12.90%)<br />
Total<br />
N=164<br />
19<br />
(11.59%)<br />
25<br />
(15.24%)<br />
7<br />
(4.27)<br />
17<br />
(10.37%)<br />
Total<br />
42<br />
(25.61%)<br />
46<br />
(28.04%)<br />
24<br />
(14.64%)<br />
32<br />
(19.52%)<br />
Table 7: Distribution of reduced in size and /or peg shaped maxillary lateral incisors by gender<br />
occurrence and presence unilaterally or bilaterally.<br />
N(%) Unilaterally Bilaterally<br />
Males 17 (10%) 16 1<br />
Females 8 (5%) 7 1<br />
Total 164 (15%) 23 2<br />
N: refers to number of subjects<br />
Table 8: Distribution of reduced in size and /or peg shaped maxillary lateral incisors according to<br />
gender in each side.<br />
Gender 17 Males 8 Females Total<br />
Side Right Left Right Left Right Left<br />
N(%) 4 (15%) 14 (52%) 2 (7%) 7 (26%) 6 (22%) <strong>21</strong> (78%)<br />
Total 18 (67%) 9 (33%) 27 (100%)<br />
N= Number of the peg lateral .<br />
Orthodontics, Pedodontics and Preventive Dentistry 102