Vol 21 No. 1
Vol 21 No. 1
Vol 21 No. 1

Create successful ePaper yourself
Turn your PDF publications into a flip-book with our unique Google optimized e-Paper software.
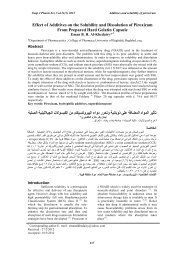
J Bagh College Dentistry <strong>Vol</strong>.<strong>21</strong>(1), 2009 Assessment of consistency …<br />
Compressive strength test: Specimens of the<br />
base materials with or with out CO 2 laser<br />
treatment were prepared as cylinders of 4mm in<br />
diameter and 6mm in length which prepared by<br />
using a stainless steel mold and kept in water bath<br />
at 37±1 0 C and 90-100% relative humidity at two<br />
intervals: 24 hours and 1 week (7days) after<br />
mixing .The compressive strength were<br />
determined by using compressive strength testing<br />
machine at speed of 1 mm/minutes, the load was<br />
applied on the long axis of the specimens .The<br />
compressive strength were measured for each<br />
specimen by detecting the force that caused early<br />
sign of fracture of the specimen.<br />
RESULTS<br />
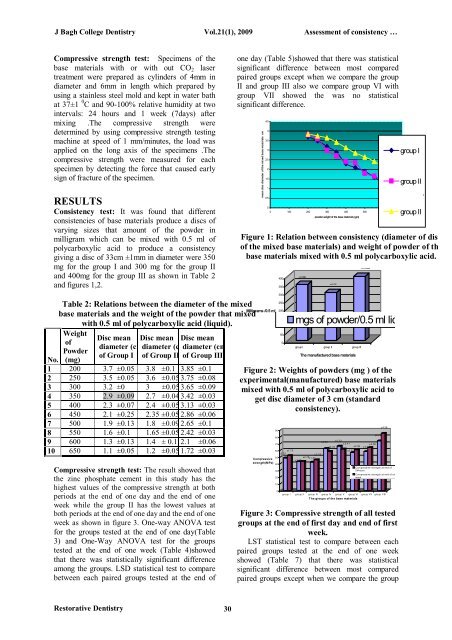
Consistency test: It was found that different<br />
consistencies of base materials produce a discs of<br />
varying sizes that amount of the powder in<br />
milligram which can be mixed with 0.5 ml of<br />
polycarboxylic acid to produce a consistency<br />
giving a disc of 33cm ±1mm in diameter were 350<br />
mg for the group I and 300 mg for the group II<br />
and 400mg for the group III as shown in Table 2<br />
and figures 1,2.<br />
one day (Table 5)showed that there was statistical<br />
significant difference between most compared<br />
paired groups except when we compare the group<br />
II and group III also we compare group VI with<br />
group VII showed the was no statistical<br />
significant difference.<br />
mean disc diameter of the mixed base materials cm<br />
4.5<br />
4<br />
3.5<br />
3<br />
2.5<br />
2<br />
1.5<br />
1<br />
0.5<br />
0<br />
0 100 200 300 400 500 600 700<br />
powder weight of the base materials (gm)<br />
group I<br />
group II<br />
group II<br />
Figure 1: Relation between consistency (diameter of disc<br />
of the mixed base materials) and weight of powder of the<br />
base materials mixed with 0.5 ml polycarboxylic acid.<br />
400<br />
350<br />
±0.087<br />
±0.05<br />
±0.0289<br />
I<br />
250<br />
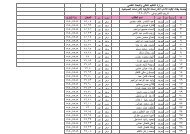
Table 2: Relations between the diameter of the mixed<br />
Milligrams /0.5 ml 200<br />
base materials and the weight of the powder that mixed<br />
150<br />
with 0.5 ml of polycarboxylic acid (liquid).<br />
100<br />
Weight<br />
50<br />
Disc mean Disc mean Disc mean<br />
of<br />
0<br />
diameter (cm) diameter (cm) diameter (cm)<br />
group I group II group III<br />
Powder<br />
of Group I of Group II of Group III<br />
The manufactured base materials<br />
<strong>No</strong>. (mg)<br />
1 200 3.7 ±0.05 3.8 ±0.1 3.85 ±0.1 Figure 2: Weights of powders (mg ) of the<br />
2 250 3.5 ±0.05 3.6 ±0.05 3.75 ±0.08 experimental(manufactured) base materials<br />
3 300 3.2 ±0 3 ±0.05 3.65 ±0.09 mixed with 0.5 ml of polycarboxylic acid to<br />
4 350 2.9 ±0.09 2.7 ±0.04 3.42 ±0.03 get disc diameter of 3 cm (standard<br />
5 400 2.3 ±0.07 2.4 ±0.05 3.13 ±0.03<br />
consistency).<br />
6 450 2.1 ±0.25 2.35 ±0.05 2.86 ±0.06<br />
7 500 1.9 ±0.13 1.8 ±0.09 2.65 ±0.1<br />
±4.36<br />
90<br />
8 550 1.6 ±0.1 1.65 ±0.05 2.42 ±0.03<br />
±4.03<br />
80<br />
±2.33<br />
±2.52<br />
9 600 1.3 ±0.13 1.4 ± 0.172.1 ±0.06<br />
70<br />
±2.41<br />
±3.59<br />
±2.34<br />
± 2.09 ±3.8<br />
60 ±1.75<br />
±2.57<br />
10 650 1.1 ±0.05 1.2 ±0.05 1.72 ±0.03<br />
±2.07<br />
Compressive strength test: The result showed that<br />
the zinc phosphate cement in this study has the<br />
highest values of the compressive strength at both<br />
periods at the end of one day and the end of one<br />
week while the group II has the lowest values at<br />
both periods at the end of one day and the end of one<br />
week as shown in figure 3. One-way ANOVA test<br />
for the groups tested at the end of one day(Table<br />
3) and One-Way ANOVA test for the groups<br />
tested at the end of one week (Table 4)showed<br />
that there was statistically significant difference<br />
among the groups. LSD statistical test to compare<br />
between each paired groups tested at the end of<br />
Compressive<br />
strength(MPa)<br />
50<br />
40<br />
30<br />
20<br />
10<br />
0<br />
300<br />
mgs of powder/0.5 ml liquid<br />
±2.35<br />
±2.78 ±1.84<br />
±2.32<br />
group I group II group III group IV group V group VI group VII group VIII<br />
The groups of the base materials<br />
Compressive strength at end of<br />
24hours<br />
Compressive strength at end of one<br />
week<br />
Figure 3: Compressive strength of all tested<br />
groups at the end of first day and end of first<br />
week.<br />
LST statistical test to compare between each<br />
paired groups tested at the end of one week<br />
showed (Table 7) that there was statistical<br />
significant difference between most compared<br />
paired groups except when we compare the group<br />
Restorative Dentistry<br />
30