Vol 21 No. 1
Vol 21 No. 1
Vol 21 No. 1

Create successful ePaper yourself
Turn your PDF publications into a flip-book with our unique Google optimized e-Paper software.
J Bagh College Dentistry <strong>Vol</strong>. <strong>21</strong>(1), 2009 Mandibular antegonial …..<br />
in origin with complete permanent dentition and<br />
age range between 18-25 years. <strong>No</strong> history of<br />
previous orthodontic, orthopedic or surgical<br />
treatment was present. Sample classification<br />
depended on the sagittal skeletal classification<br />
according to Houston (14) , Foster (15) , Rani (16) ,<br />
Mitchell and Carter (17) :<br />
Skeletal Cl I: 2° ≤ ANB ≤ 4°.<br />
Skeletal Cl II: ANB > 4°.<br />
Skeletal Cl III: ANB < 2°.<br />
Every lateral cephalometric radiograph was<br />
digitized by AutoCAD (2007) software computer<br />
program to calculate angular and linear<br />
measurements. First of all every radiograph was<br />
copied twice; one for angular and one for linear<br />
measurements, then cephalometric points were<br />
located for each one and lines joined between<br />
these points to form angles and planes.<br />
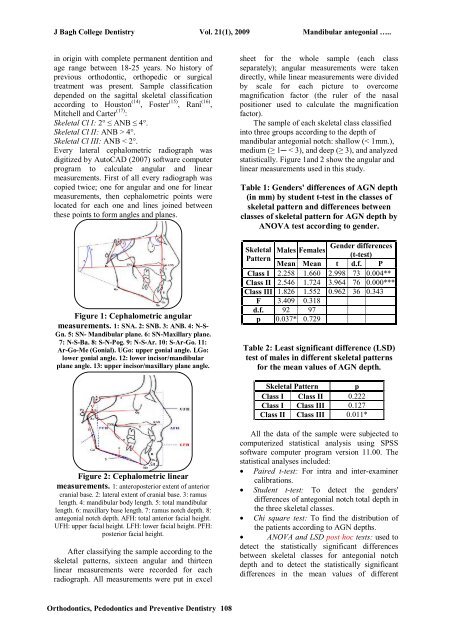
Figure 1: Cephalometric angular<br />
measurements. 1: SNA. 2: SNB. 3: ANB. 4: N-S-<br />
Gn. 5: SN- Mandibular plane. 6: SN-Maxillary plane.<br />
7: N-S-Ba. 8: S-N-Pog. 9: N-S-Ar. 10: S-Ar-Go. 11:<br />
Ar-Go-Me (Gonial). UGo: upper gonial angle. LGo:<br />
lower gonial angle. 12: lower incisor/mandibular<br />
plane angle. 13: upper incisor/maxillary plane angle.<br />
sheet for the whole sample (each class<br />
separately); angular measurements were taken<br />
directly, while linear measurements were divided<br />
by scale for each picture to overcome<br />
magnification factor (the ruler of the nasal<br />
positioner used to calculate the magnification<br />
factor).<br />
The sample of each skeletal class classified<br />
into three groups according to the depth of<br />
mandibular antegonial notch: shallow (< 1mm.),<br />
medium (≥ 1─ < 3), and deep (≥ 3), and analyzed<br />
statistically. Figure 1and 2 show the angular and<br />
linear measurements used in this study.<br />
Table 1: Genders' differences of AGN depth<br />
(in mm) by student t-test in the classes of<br />
skeletal pattern and differences between<br />
classes of skeletal pattern for AGN depth by<br />
ANOVA test according to gender.<br />
Gender differences<br />
Skeletal Males Females<br />
(t-test)<br />
Pattern<br />
Mean Mean t d.f. P<br />
Class I 2.258 1.660 2.998 73 0.004**<br />
Class II 2.546 1.724 3.964 76 0.000***<br />
Class III 1.826 1.552 0.962 36 0.343<br />
F 3.409 0.318<br />
d.f. 92 97<br />
p 0.037* 0.729<br />
Table 2: Least significant difference (LSD)<br />
test of males in different skeletal patterns<br />
for the mean values of AGN depth.<br />
Skeletal Pattern p<br />
Class I Class II 0.222<br />
Class I Class III 0.127<br />
Class II Class III 0.011*<br />
Figure 2: Cephalometric linear<br />
measurements. 1: anteroposterior extent of anterior<br />
cranial base. 2: lateral extent of cranial base. 3: ramus<br />
length. 4: mandibular body length. 5: total mandibular<br />
length. 6: maxillary base length. 7: ramus notch depth. 8:<br />
antegonial notch depth. AFH: total anterior facial height.<br />
UFH: upper facial height. LFH: lower facial height. PFH:<br />
posterior facial height.<br />
After classifying the sample according to the<br />
skeletal patterns, sixteen angular and thirteen<br />
linear measurements were recorded for each<br />
radiograph. All measurements were put in excel<br />
All the data of the sample were subjected to<br />
computerized statistical analysis using SPSS<br />
software computer program version 11.00. The<br />
statistical analyses included:<br />
• Paired t-test: For intra and inter-examiner<br />
calibrations.<br />
• Student t-test: To detect the genders'<br />
differences of antegonial notch total depth in<br />
the three skeletal classes.<br />
• Chi square test: To find the distribution of<br />
the patients according to AGN depths.<br />
• ANOVA and LSD post hoc tests: used to<br />
detect the statistically significant differences<br />
between skeletal classes for antegonial notch<br />
depth and to detect the statistically significant<br />
differences in the mean values of different<br />
Orthodontics, Pedodontics and Preventive Dentistry 108