Here - American Geriatrics Society
Here - American Geriatrics Society
Here - American Geriatrics Society
Create successful ePaper yourself
Turn your PDF publications into a flip-book with our unique Google optimized e-Paper software.
P OSTER<br />
A BSTRACTS<br />
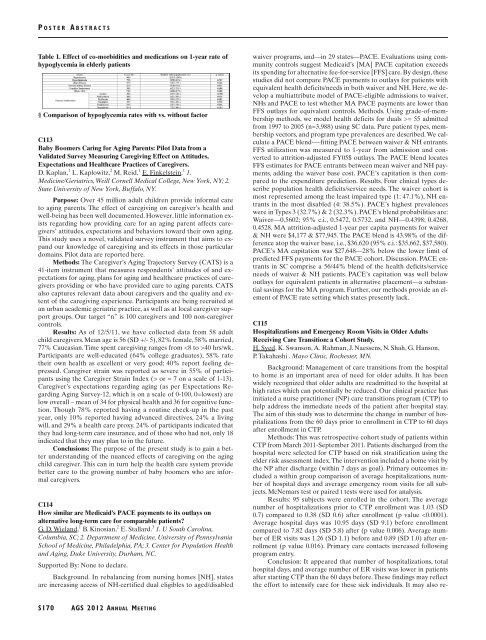
Table 1. Effect of co-morbidities and medications on 1-year rate of<br />
hypoglycemia in elderly patients<br />
§ Comparison of hypoglycemia rates with vs. without factor<br />
C113<br />
Baby Boomers Caring for Aging Parents: Pilot Data from a<br />
Validated Survey Measuring Caregiving Effect on Attitudes,<br />
Expectations and Healthcare Practices of Caregivers.<br />
D. Kaplan, 1 L. Kaplowitz, 2 M. Reid, 1 E. Finkelstein. 1 1.<br />
Medicine/<strong>Geriatrics</strong>, Weill Cornell Medical College, New York, NY; 2.<br />
State University of New York, Buffalo, NY.<br />
Purpose: Over 45 million adult children provide informal care<br />
to aging parents. The effect of caregiving on caregiver’s health and<br />
well-being has been well documented. However, little information exists<br />
regarding how providing care for an aging parent affects caregivers’<br />
attitudes, expectations and behaviors toward their own aging.<br />
This study uses a novel, validated survey instrument that aims to expand<br />
our knowledge of caregiving and its effects in those particular<br />
domains. Pilot data are reported here.<br />
Methods: The Caregiver’s Aging Trajectory Survey (CATS) is a<br />
41-item instrument that measures respondents’ attitudes of and expectations<br />
for aging, plans for aging and healthcare practices of caregivers<br />
providing or who have provided care to aging parents. CATS<br />
also captures relevant data about caregivers and the quality and extent<br />
of the caregiving experience. Participants are being recruited at<br />
an urban academic geriatric practice, as well as at local caregiver support<br />
groups. Our target “n” is 100 caregivers and 100 non-caregiver<br />
controls.<br />
Results: As of 12/5/11, we have collected data from 58 adult<br />
child caregivers. Mean age is 56 (SD +/- 5), 82% female, 58% married,<br />
77% Caucasian. Time spent caregiving ranges from 40 hrs/wk.<br />
Participants are well-educated (64% college graduates), 58% rate<br />
their own health as excellent or very good; 40% report feeling depressed.<br />
Caregiver strain was reported as severe in 55% of participants<br />
using the Caregiver Strain Index (> or = 7 on a scale of 1-13).<br />
Caregiver’s expectations regarding aging (as per Expectations Regarding<br />
Aging Survey-12, which is on a scale of 0-100, 0=lowest) are<br />
low overall – mean of 34 for physical health and 36 for cognitive function.<br />
Though 78% reported having a routine check-up in the past<br />
year, only 10% reported having advanced directives, 24% a living<br />
will, and 29% a health care proxy. 24% of participants indicated that<br />
they had long-term care insurance, and of those who had not, only 18<br />
indicated that they may plan to in the future.<br />
Conclusions: The purpose of the present study is to gain a better<br />
understanding of the nuanced effects of caregiving on the aging<br />
child caregiver. This can in turn help the health care system provide<br />
better care to the growing number of baby boomers who are informal<br />
caregivers.<br />
C114<br />
How similar are Medicaid’s PACE payments to its outlays on<br />
alternative long-term care for comparable patients?<br />
G. D. Wieland, 1 B. Kinosian, 2 E. Stallard. 3 1. U South Carolina,<br />
Columbia, SC; 2. Department of Medicine, University of Pennsylvania<br />
School of Medicine, Philadelphia, PA; 3. Center for Population Health<br />
and Aging, Duke University, Durham, NC.<br />
Supported By: None to declare.<br />
Background. In rebalancing from nursing homes [NH], states<br />
are increasing access of NH-certified dual eligibles to aged/disabled<br />
waiver programs, and—in 29 states—PACE. Evaluations using community<br />
controls suggest Medicaid’s [MA] PACE capitation exceeds<br />
its spending for alternative fee-for-service [FFS] care. By design, these<br />
studies did not compare PACE payments to outlays for patients with<br />
equivalent health deficits/needs in both waiver and NH. <strong>Here</strong>, we develop<br />
a multiattribute model of PACE-eligible admissions to waiver,<br />
NHs and PACE to test whether MA PACE payments are lower than<br />
FFS outlays for equivalent controls. Methods. Using grade-of-membership<br />
methods, we model health deficits for duals >= 55 admitted<br />
from 1997 to 2005 (n=3,988) using SC data. Pure patient types, membership<br />
vectors, and program type prevalences are described. We calculate<br />
a PACE blend-—fitting PACE between waiver & NH entrants.<br />
FFS utilization was measured to 1-year from admission and converted<br />
to attrition-adjusted FY05$ outlays. The PACE blend locates<br />
FFS estimates for PACE entrants between mean waiver and NH payments,<br />
adding the waiver base cost. PACE’s capitation is then compared<br />
to the expenditure prediction. Results. Four clinical types describe<br />
population health deficits/service needs. The waiver cohort is<br />
most represented among the least impaired type (1: 47.1%), NH entrants<br />
in the most disabled (4: 38.5%). PACE’s highest prevalences<br />
were in Types 3 (32.7%) & 2 (32.3%). PACE’s blend probabilities are:<br />
Waiver—0.5602; 95% c.i., 0.5472, 0.5732, and NH—0.4398; 0.4268,<br />
0.4528. MA attrition-adjusted 1-year per capita payments for waiver<br />
& NH were $4,177 & $77,945. The PACE blend is 43.98% of the difference<br />
atop the waiver base, i.e., $36,620 (95% c.i.: $35,662, $37,580).<br />
PACE’s MA capitation was $27,648—28% below the lower limit of<br />
predicted FFS payments for the PACE cohort. Discussion. PACE entrants<br />
in SC comprise a 56/44% blend of the health deficits/service<br />
needs of waiver & NH patients. PACE’s capitation was well below<br />
outlays for equivalent patients in alternative placement—a substantial<br />
savings for the MA program. Further, our methods provide an element<br />
of PACE rate setting which states presently lack.<br />
C115<br />
Hospitalizations and Emergency Room Visits in Older Adults<br />
Receiving Care Transition: a Cohort Study.<br />
H. Syed, K. Swanson, A. Rahman, J. Naessens, N. Shah, G. Hanson,<br />
P. Takahashi . Mayo Clinic, Rochester, MN.<br />
Background: Management of care transitions from the hospital<br />
to home is an important area of need for older adults. It has been<br />
widely recognized that older adults are readmitted to the hospital at<br />
high rates which can potentially be reduced. Our clinical practice has<br />
initiated a nurse practitioner (NP) care transitions program (CTP) to<br />
help address the immediate needs of the patient after hospital stay.<br />
The aim of this study was to determine the change in number of hospitalizations<br />
from the 60 days prior to enrollment in CTP to 60 days<br />
after enrollment in CTP.<br />
Methods: This was retrospective cohort study of patients within<br />
CTP from March 2011-September 2011. Patients discharged from the<br />
hospital were selected for CTP based on risk stratification using the<br />
elder risk assessment index. The intervention included a home visit by<br />
the NP after discharge (within 7 days as goal). Primary outcomes included<br />
a within group comparison of average hospitalizations, number<br />
of hospital days and average emergency room visits for all subjects.<br />
McNemars test or paired t tests were used for analysis.<br />
Results: 95 subjects were enrolled in the cohort. The average<br />
number of hospitalizations prior to CTP enrollment was 1.03 (SD<br />
0.7) compared to 0.38 (SD 0.6) after enrollment (p value


