Probabilistic Performance Analysis of Fault Diagnosis Schemes
Probabilistic Performance Analysis of Fault Diagnosis Schemes
Probabilistic Performance Analysis of Fault Diagnosis Schemes

Create successful ePaper yourself
Turn your PDF publications into a flip-book with our unique Google optimized e-Paper software.
1<br />
P tn,k<br />
0.8<br />
P fp,k<br />
P fn,k<br />
(a)<br />
Probability<br />
0.6<br />
0.4<br />
P tp,k<br />
0.2<br />
0<br />
1<br />
0 10 20 30 40 50 60<br />
P d,k<br />
0.8<br />
P f,k<br />
Q 0,k<br />
(b)<br />
Probability<br />
0.6<br />
0.4<br />
0.2<br />
0<br />
0 10 20 30 40 50 60<br />
Time (min)<br />
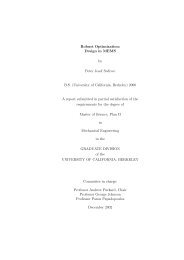
Figure 6.3. <strong>Performance</strong> metrics for the air-data sensor system. Plot (a) shows the joint probability<br />
performance metrics, and plot (b) shows the conditional probability performance metrics. Note that<br />
the sequences {P fn,k } and {P tp,k } have small values and are barely distinguishable from zero.<br />
Table 6.1. Steady-state performance <strong>of</strong> the air-data sensor system for various values <strong>of</strong> the washout<br />
filter pole a and the noise standard deviation σ. Note that the values <strong>of</strong> the pole a refer to the<br />
continuous-time dynamics before discretization, but the standard deviation σ refers to the discretized<br />
iid Gaussian noise sequences (i.e., σ s = σ t = σ).<br />
Noise Standard Deviation, σ (Pa)<br />
Pole, a 2 4 6 8 10<br />
0.0005 0.9742 0.9482 0.9216 0.8943 0.8662<br />
0.001 0.9739 0.9469 0.9183 0.8875 0.8534<br />
0.0015 0.9736 0.9454 0.9137 0.8756 0.8211<br />
0.002 0.9732 0.9435 0.9064 0.8423 0.7303<br />
0.0025 0.9729 0.9410 0.8879 0.7631 0.5968<br />
0.003 0.9725 0.9373 0.8427 0.6517 0.4692<br />
0.0035 0.9720 0.9291 0.7687 0.5387 0.3680<br />
0.004 0.9715 0.9104 0.6790 0.4411 0.2933<br />
106