Probabilistic Performance Analysis of Fault Diagnosis Schemes
Probabilistic Performance Analysis of Fault Diagnosis Schemes
Probabilistic Performance Analysis of Fault Diagnosis Schemes

Create successful ePaper yourself
Turn your PDF publications into a flip-book with our unique Google optimized e-Paper software.
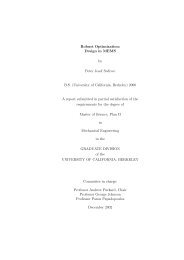
1<br />
ε increasing<br />
ε = 0<br />
Pd,k<br />
Probability <strong>of</strong> Detection,<br />
0.5<br />
0<br />
ε → ∞<br />
0 0.5 1<br />
Probability <strong>of</strong> False Alarm,<br />
P f,k<br />
Figure 3.4. Set <strong>of</strong> performance points achieved by the family <strong>of</strong> tests given in equation (3.18). Varying<br />
the threshold ε yields a curve <strong>of</strong> performance points passing through (0,0) and (1,1). Randomization<br />
can be used to achieve any performance in the convex hull <strong>of</strong> this curve (shaded region).<br />
availability is to require that<br />
P tn,k > a,<br />
for k = 0,1,..., N . This type <strong>of</strong> bound is shown in Figure 3.5(a), where the constraint fails to<br />
hold for k > k f . In terms <strong>of</strong> the performance metrics, the availability may be written as<br />
P tn,k = (1 − P f,k )Q 0,k ,<br />
for all k. Thus, the lower bound on availability can be translated to a time-varying upper<br />
bound on P f,k , as follows:<br />
P f,k < 1 −<br />
a ,<br />
Q 0,k<br />
for k = 0,1,..., N . This type <strong>of</strong> bound is shown in Figure 3.5(b). Note that no fault detection<br />
scheme can satisfy the bound on availability once Q 0,k ≤ a.<br />
Given β > α > 0, another natural performance criterion is to assert that the performance<br />
metrics P f,k and P d,k satisfy the constraints<br />
P f,k < α and P d,k > β,<br />
for all k. A visualization <strong>of</strong> this type <strong>of</strong> bound is shown in Figure 3.6. In Figure 3.7, this<br />
constraint can be visualized in roc space by plotting the roc curves at a number <strong>of</strong> time<br />
steps {k 0 ,k 1 ,...,k m }. Unlike P tn,k which eventually converges to 0, the metrics P f,k and<br />
P d,k <strong>of</strong>ten converge to steady-state values, so the visualization in Figure 3.7 can depict the<br />
36