Probabilistic Performance Analysis of Fault Diagnosis Schemes
Probabilistic Performance Analysis of Fault Diagnosis Schemes
Probabilistic Performance Analysis of Fault Diagnosis Schemes

You also want an ePaper? Increase the reach of your titles
YUMPU automatically turns print PDFs into web optimized ePapers that Google loves.
1<br />
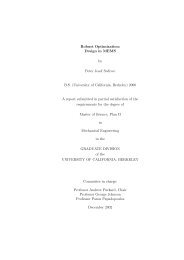
ε increasing<br />
Pd,k<br />
Probability <strong>of</strong> Detection,<br />
0.5<br />
0<br />
0 0.5 1<br />
Probability <strong>of</strong> False Alarm,<br />
P f,k<br />
Figure 6.4. <strong>Performance</strong> metrics for the air-data sensor system plotted in roc space. Each roc curve<br />
represents the performance <strong>of</strong> the fault detection scheme shown in Figure 6.1 at a particular time step<br />
as the threshold ε on the decision function δ is varied.<br />
Section 5.2.1 by using the proportional threshold<br />
ε k = ν √ Σ k ,<br />
where ν = 2.25. We use the yalmip interface [63] to SeDuMi [90] to solve the optimization<br />
problem. The resulting worst-case values Pf ⋆ (γ) are plotted in Figure 6.5 for γ ranging from 0<br />
to 10.<br />
Finally, we compute the worst-case fault signal, with respect to the probability <strong>of</strong> detection.<br />
For this computation, we assume that there are no other sources <strong>of</strong> uncertainty. Let ϑ<br />
be the fault parameter sequence in which both sensors fail at k = 18,000 (15 minutes). The<br />
class <strong>of</strong> uncertain fault signals considered is<br />
B 2 (f ◦ ,γ) = { ˜ f + f ◦ (ϑ) : ‖ ˜ f ‖ 2 < γ } ,<br />
where f ◦ (ϑ) is the nominal bias fault with magnitudes b s and b f defined above. The time<br />
horizon <strong>of</strong> the simulation is shortened to 17 minutes (i.e., N = 20,400 time steps). Hence, the<br />
signal f ˜ must decrease the probability <strong>of</strong> detection (i.e., suppress the effect <strong>of</strong> the nominal<br />
fault f ◦ (ϑ)) over a 2 minute interval. Again, we use the yalmip interface [63] to formulate the<br />
optimization problem and SeDuMi [90] to solve it. The resulting worst-case values Pd ⋆ (γ) are<br />
plotted in Figure 6.6 for γ ranging from 1.5 to 2.0. Note that, for each γ, the value <strong>of</strong> Pd ⋆(γ)<br />
would increase as the number <strong>of</strong> time steps N is increased, because the perturbation f ˜<br />
would have to suppress the effect <strong>of</strong> f ◦ (ϑ) over a longer time span. That is, increasing N<br />
107