Probabilistic Performance Analysis of Fault Diagnosis Schemes
Probabilistic Performance Analysis of Fault Diagnosis Schemes
Probabilistic Performance Analysis of Fault Diagnosis Schemes

You also want an ePaper? Increase the reach of your titles
YUMPU automatically turns print PDFs into web optimized ePapers that Google loves.
1<br />
ideal<br />
roc<br />
Pd,k<br />
Probability <strong>of</strong> Detection,<br />
0.5<br />
(α,β)<br />
W k<br />
( 12<br />
, 1 2<br />
)<br />
(1 − α,1 − β)<br />
0<br />
0 0.5 1<br />
Probability <strong>of</strong> False Alarm,<br />
P f,k<br />
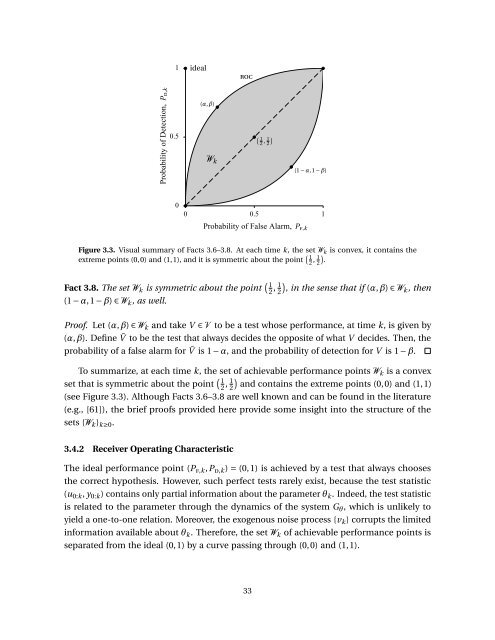
Figure 3.3. Visual summary <strong>of</strong> Facts 3.6–3.8. At each time k, the set W k is convex, it contains the<br />
extreme points (0,0) and (1,1), and it is symmetric about the point ( 1<br />
2 , 1 2<br />
)<br />
.<br />
Fact 3.8. The set W k is symmetric about the point ( 1<br />
2 , 1 2)<br />
, in the sense that if (α,β) ∈ Wk , then<br />
(1 − α,1 − β) ∈ W k , as well.<br />
Pro<strong>of</strong>. Let (α,β) ∈ W k and take V ∈ V to be a test whose performance, at time k, is given by<br />
(α,β). Define ¯V to be the test that always decides the opposite <strong>of</strong> what V decides. Then, the<br />
probability <strong>of</strong> a false alarm for ¯V is 1 − α, and the probability <strong>of</strong> detection for V is 1 − β.<br />
To summarize, at each time k, the set <strong>of</strong> achievable performance points W k is a convex<br />
set that is symmetric about the point ( 1<br />
2 , 1 2)<br />
and contains the extreme points (0,0) and (1,1)<br />
(see Figure 3.3). Although Facts 3.6–3.8 are well known and can be found in the literature<br />
(e.g., [61]), the brief pro<strong>of</strong>s provided here provide some insight into the structure <strong>of</strong> the<br />
sets {W k } k≥0 .<br />
3.4.2 Receiver Operating Characteristic<br />
The ideal performance point (P f,k ,P d,k ) = (0,1) is achieved by a test that always chooses<br />
the correct hypothesis. However, such perfect tests rarely exist, because the test statistic<br />
(u 0:k , y 0:k ) contains only partial information about the parameter θ k . Indeed, the test statistic<br />
is related to the parameter through the dynamics <strong>of</strong> the system G θ , which is unlikely to<br />
yield a one-to-one relation. Moreover, the exogenous noise process {v k } corrupts the limited<br />
information available about θ k . Therefore, the set W k <strong>of</strong> achievable performance points is<br />
separated from the ideal (0,1) by a curve passing through (0,0) and (1,1).<br />
33