Probabilistic Performance Analysis of Fault Diagnosis Schemes
Probabilistic Performance Analysis of Fault Diagnosis Schemes
Probabilistic Performance Analysis of Fault Diagnosis Schemes

Create successful ePaper yourself
Turn your PDF publications into a flip-book with our unique Google optimized e-Paper software.
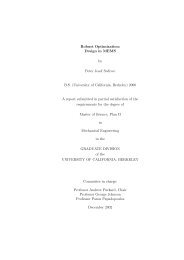
z max<br />
(a)<br />
Up−Down Counter State, z<br />
τ<br />
0<br />
(b)<br />
Residual, r<br />
ε<br />
0<br />
−ε<br />
0 k 1<br />
k 2<br />
Time Step, k<br />
Figure 4.3. Comparison <strong>of</strong> the behavior <strong>of</strong> an up-down counter (a) and the behavior <strong>of</strong> the underlying<br />
threshold decision function (b). The horizontal blue lines indicated the threshold regions, and the<br />
vertical shaded bands indicate the ranges <strong>of</strong> time where the respective decision function signals that a<br />
fault has occurred. The actual fault starts at time k 1 and stops at time k 2 .<br />
to the point where the number <strong>of</strong> false alarms is reasonable, the delay <strong>of</strong> the original threshold<br />
decision function would be even greater. Therefore, in this case, the up-down counter<br />
actually responds more quickly.<br />
Note that for α > 0, the parameters (C d α,C u α,τα, z max α) define an equivalent up-down<br />
counter with state space<br />
Z α := {0,α,2α,..., z max α}.<br />
In the special case where<br />
C d = C u = τ = z max ,<br />
the decisions produced by the up-down counter are identical to those produced by the<br />
original decision function (i.e., dk ˆ = d k , for all k).<br />
65