Probabilistic Performance Analysis of Fault Diagnosis Schemes
Probabilistic Performance Analysis of Fault Diagnosis Schemes
Probabilistic Performance Analysis of Fault Diagnosis Schemes

Create successful ePaper yourself
Turn your PDF publications into a flip-book with our unique Google optimized e-Paper software.
1<br />
P tn,k<br />
0.8<br />
P fp,k<br />
P fn,k<br />
(a)<br />
Probability<br />
0.6<br />
0.4<br />
P tp,k<br />
0.2<br />
0<br />
1<br />
0 5 10 15 20 25 30<br />
P d,k<br />
0.8<br />
P f,k<br />
Q 0,k<br />
(b)<br />
Probability<br />
0.6<br />
0.4<br />
0.2<br />
0<br />
0 10 20 30 40 50 60<br />
Time (min)<br />
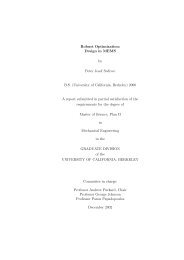
Figure 6.8. <strong>Performance</strong> metrics for the vtol aircraft example with observer gain L 1 . Plot (a) shows<br />
the joint probability performance metrics, and plot (b) shows the conditional probability performance<br />
metrics. Note that the sequences {P fn,k } and {P tp,k } are barely distinguishable from zero.<br />
Table 6.2. Steady-state values <strong>of</strong> the performance metrics for the vtol aircraft example. For each<br />
observer gain L i , the steady-state value is taken to be the value achieved at the final time step N .<br />
<strong>Performance</strong> Metrics<br />
Gain P tn,N P fp,N P fn,N P tp,N P f,N P d,N<br />
L 1 0.9735 0.02439 1.082 × 10 −5 1.998 × 10 −3 0.02444 0.9946<br />
L 2 0.9735 0.02439 4.496 × 10 −5 1.965 × 10 −3 0.02444 0.9776<br />
L 3 0.9735 0.02439 1.082 × 10 −5 1.998 × 10 −3 0.02444 0.9946<br />
113