Probabilistic Performance Analysis of Fault Diagnosis Schemes
Probabilistic Performance Analysis of Fault Diagnosis Schemes
Probabilistic Performance Analysis of Fault Diagnosis Schemes

You also want an ePaper? Increase the reach of your titles
YUMPU automatically turns print PDFs into web optimized ePapers that Google loves.
2.3 Reliability Theory<br />
In this section, we present a select set <strong>of</strong> definitions and results from the vast field <strong>of</strong><br />
reliability theory. The purpose is to establish two useful probabilistic models for the failure<br />
time <strong>of</strong> a system or component. For a thorough treatment <strong>of</strong> reliability theory, see Rausand<br />
and Høyland [77] or Singpurwalla [85].<br />
Let (Ω,F , P) be a probability space, and let τ: Ω → R + := [0,∞) be a random variable that<br />
represents the time at which some system or component fails. As in the previous section,<br />
let P τ and p τ denote the cumulative distribution function (cdf) and probability density<br />
function (pdf) <strong>of</strong> τ, respectively.<br />
Definition 2.2. The mean time to failure (mttf) <strong>of</strong> τ is defined as E(τ).<br />
Definition 2.3. The failure rate is defined as the expected number <strong>of</strong> failures in some interval<br />
<strong>of</strong> time, given that no failure has occurred yet. For ∆ > 0, the failure rate <strong>of</strong> τ at time t ≥ 0 is<br />
P(t < τ ≤ t + ∆ | τ > t)<br />
ρ ∆ (t) :=<br />
∆<br />
= P τ(t + ∆) − P τ (t)<br />
∆ ( 1 − P τ (t) ) .<br />
Definition 2.4. The hazard rate <strong>of</strong> τ at time t ≥ 0 is defined as<br />
h(t) := lim ρ ∆ (t) =<br />
p τ(t)<br />
∆→0 1 − P τ (t) .<br />
Suppose that, for a given sample time T s > 0, the failure time is modeled as a discretevalued<br />
random variable κ: Ω → Z + := {0,1,...}. That is, for all k ∈ Z + , the event {κ = k}<br />
indicates a failure at time kT s . In this case, the interval ∆ must be a multiple <strong>of</strong> the sample<br />
time T s , so the hazard rate converges to<br />
h(k) = ρ Ts (k) = P κ(k + 1) − P κ (k)<br />
T s<br />
(<br />
1 − Pκ (k) ) .<br />
However, there are cases where the discrete failure time κ does not have an underlying<br />
sample time. In such cases, the hazard rate is defined as<br />
h(k) = ρ 1 (k) = P κ(k + 1) − P κ (k)<br />
.<br />
1 − P κ (k)<br />
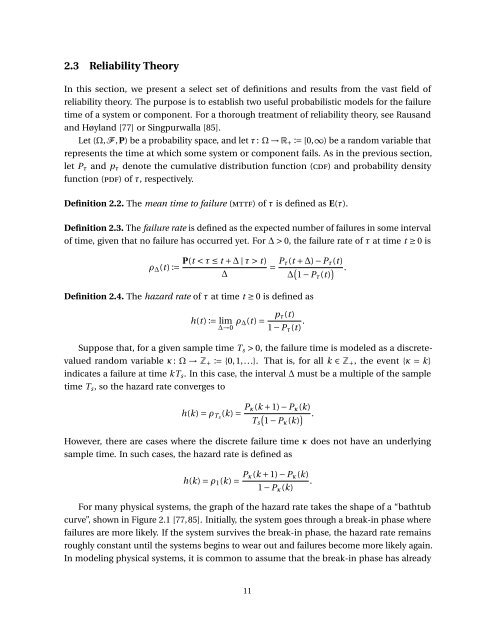
For many physical systems, the graph <strong>of</strong> the hazard rate takes the shape <strong>of</strong> a “bathtub<br />
curve”, shown in Figure 2.1 [77,85]. Initially, the system goes through a break-in phase where<br />
failures are more likely. If the system survives the break-in phase, the hazard rate remains<br />
roughly constant until the systems begins to wear out and failures become more likely again.<br />
In modeling physical systems, it is common to assume that the break-in phase has already<br />
11