Annual Report 1999 - Kemira
Annual Report 1999 - Kemira
Annual Report 1999 - Kemira

Create successful ePaper yourself
Turn your PDF publications into a flip-book with our unique Google optimized e-Paper software.
Far East. In Denmark, potassium nitrate<br />
production was expanded, and the plant<br />
extension is being continued through a<br />
new investment that is expected to be<br />
completed in the autumn of 2000.<br />
NPK projects in Southeast Asia progressed<br />
according to plans and the plant<br />
of a joint venture in Malesia, in which<br />
<strong>Kemira</strong> Agro has a 30% holding, started<br />
up in mid-<strong>1999</strong>. Construction works on<br />
the plant in China continued ahead and<br />
the facility is expected to reach completion<br />
in the autumn of 2000. <strong>Kemira</strong> Agro<br />
has a 49% interest and Finnfund a 26%<br />
interest in the joint venture in China.<br />
In Finland, <strong>Kemira</strong> Agro purchased<br />
an 20% holding in the Suomen Rehu animal<br />
feed business, thereby strengthening<br />
the logistics co-operation that has already<br />
been started.<br />
The development programme that<br />
was launched at the beginning of 1998<br />
at <strong>Kemira</strong> Agro has progressed according<br />
to plans. Its objective is to achieve a<br />
significant improvement in earnings,<br />
which will show up to the full extent in<br />
2001.<br />
KEMIRA PIGMENTS<br />
<strong>Kemira</strong> Pigments’ net sales rose by 15%<br />
and were EUR 488 million. Average selling<br />
prices for titanium dioxide pigments<br />
during the year were at the previous<br />
year’s level. Selling prices in the September-December<br />
period were about 2%<br />
lower than prices in the May-August period<br />
and prices in the last four months<br />
of 1998.<br />
Sales volumes of titanium dioxide<br />
pigments were 13% higher than they<br />
were a year earlier. The sales volume in<br />
the last four months of the year was 25%<br />
higher than it was in the last four<br />
months of the previous year, a situation<br />
that may be partly attributable to the<br />
precautions taken by customers on the<br />
eve of the new millennium.<br />
Demand was in decline in Europe<br />
and Asia in the previous year, but it<br />
swung to strong growth during <strong>1999</strong>,<br />
particularly after the January-April period.<br />
In North America demand remained<br />
good, though in Latin America it was<br />
weak throughout the year.<br />
Changes in the titanium dioxide industry<br />
continued when the American<br />
company Huntsman Chemicals acquired<br />
Tioxide from ICI. <strong>Kemira</strong> is also peeling<br />
off its plants in the United States and the<br />
Netherlands.<br />
<strong>Kemira</strong> Pigments’ operating income<br />
was EUR 35 million (22 million in 1998),<br />
or 7% of net sales. Operating income in<br />
the September-December period was<br />
EUR 18 million, as against EUR 10 million<br />
in the previous four month period<br />
and EUR 7 million in the last four month<br />
period of the previous year. A change in<br />
the actuarial assumptions for calculating<br />
the liability of Finnish pension funds resulted<br />
in a non-recurring reversal of<br />
about EUR 3 million in contributions to<br />
the supplementary pension foundation<br />
in the September-December period,<br />
whereas in the previous year the change<br />
resulted in having to book a one-off expense<br />
of the same size.<br />
The debottlenecking project at the<br />
Pori plant was completed according to<br />
plans towards the end of the <strong>1999</strong>.<br />
Thereafter the Pori unit’s production capacity<br />
will be 120,000 tonnes a year.<br />
OTHER UNITS<br />
<strong>Kemira</strong> Metalkat, which manufactures<br />
catalytic converters, reported net sales<br />
growth of 19%, to EUR 36 million. Operating<br />
income was EUR 3.1 million, as<br />
against EUR 1.7 million a year earlier.<br />
Net sales by <strong>Kemira</strong> Safety, which manufactures<br />
personal protection equipment,<br />
were down 1%, to EUR 14 million. Operating<br />
income was EUR 0.9 million (1.3<br />
million in 1998).<br />
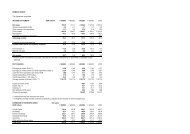
GROUP FINANCIAL PERFORMANCE<br />
The Group’s operating income was EUR<br />
111 million (148 million in 1998), or 4%<br />
of net sales. This figure includes a total<br />
of EUR 28 million of non-recurring net<br />
costs. Income before taxes and minority<br />
interests was 59 million (97 million in<br />
1998). Net financial expenses were EUR<br />
52 million (51 million in 1998). Income<br />
after taxes was EUR 30 million (79 million<br />
in 1998). The effective tax rate rose<br />
from 20% to 47%. The increase in the effective<br />
tax rate was mainly due to the<br />
non-recurring costs booked. As was reported<br />
in the previous year’s financial<br />
statements, taxes in the 1998 income<br />
statement were reduced by an EUR 14<br />
million deferred taxes item which resulted<br />
from a review of the accounting policy<br />
in line with changed IAS rules. The<br />
return on capital invested was 5.9%<br />
(8.3%).<br />
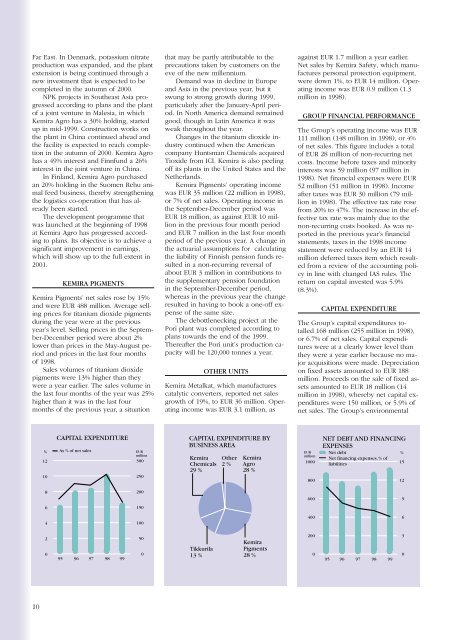
CAPITAL EXPENDITURE<br />
The Group’s capital expenditures totalled<br />
168 million (255 million in 1998),<br />
or 6.7% of net sales. Capital expenditures<br />
were at a clearly lower level than<br />
they were a year earlier because no major<br />
acquisitions were made. Depreciation<br />
on fixed assets amounted to EUR 188<br />
million. Proceeds on the sale of fixed assets<br />
amounted to EUR 18 million (14<br />
million in 1998), whereby net capital expenditures<br />
were 150 million, or 5.9% of<br />
net sales. The Group’s environmental<br />
INVESTOINNIT<br />
CAPITAL EXPENDITURE<br />
% As % of net sales<br />
12<br />
10<br />
euroa EUR<br />
million<br />
300<br />
250<br />
CAPITAL EXPENDITURE BY<br />
BUSINESS AREA<br />
<strong>Kemira</strong><br />
Chemicals<br />
29 %<br />
Other<br />
2 %<br />
<strong>Kemira</strong><br />
Agro<br />
28 %<br />
EUR<br />
million<br />
1000<br />
800<br />
NET DEBT AND FINANCING<br />
EXPENSES<br />
Net debt<br />
Net financing expenses, % of<br />
liabilities<br />
%<br />
15<br />
12<br />
8<br />
200<br />
600<br />
9<br />
6<br />
150<br />
4<br />
100<br />
400<br />
6<br />
2<br />
0<br />
95 96 97 98 99<br />
50<br />
0<br />
Tikkurila<br />
13 %<br />
<strong>Kemira</strong><br />
Pigments<br />
28 %<br />
200<br />
0<br />
95 96 97 98 99<br />
3<br />
0<br />
10