Annual Report 1999 - Kemira
Annual Report 1999 - Kemira
Annual Report 1999 - Kemira

Create successful ePaper yourself
Turn your PDF publications into a flip-book with our unique Google optimized e-Paper software.
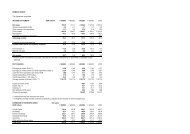
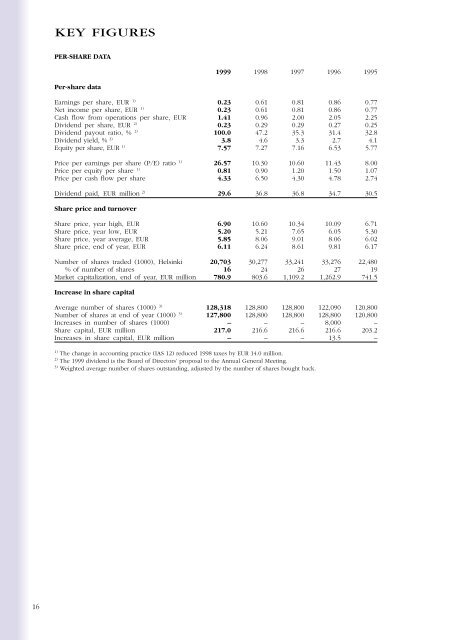
KEY FIGURES<br />
PER-SHARE DATA<br />
<strong>1999</strong> 1998 1997 1996 1995<br />
Per-share data<br />
Earnings per share, EUR 1) 0.23 0.61 0.81 0.86 0.77<br />
Net income per share, EUR 1) 0.23 0.61 0.81 0.86 0.77<br />
Cash flow from operations per share, EUR 1.41 0.96 2.00 2.05 2.25<br />
Dividend per share, EUR 2) 0.23 0.29 0.29 0.27 0.25<br />
Dividend payout ratio, % 2) 100.0 47.2 35.3 31.4 32.8<br />
Dividend yield, % 2) 3.8 4.6 3.3 2.7 4.1<br />
Equity per share, EUR 1) 7.57 7.27 7.16 6.53 5.77<br />
Price per earnings per share (P/E) ratio 1) 26.57 10.30 10.60 11.43 8.00<br />
Price per equity per share 1) 0.81 0.90 1.20 1.50 1.07<br />
Price per cash flow per share 4.33 6.50 4.30 4.78 2.74<br />
Dividend paid, EUR million 2) 29.6 36.8 36.8 34.7 30.5<br />
Share price and turnover<br />
Share price, year high, EUR 6.90 10.60 10.34 10.09 6.71<br />
Share price, year low, EUR 5.20 5.21 7.65 6.05 5.30<br />
Share price, year average, EUR 5.85 8.06 9.01 8.06 6.02<br />
Share price, end of year, EUR 6.11 6.24 8.61 9.81 6.17<br />
Number of shares traded (1000), Helsinki 20,703 30,277 33,241 33,276 22,480<br />
% of number of shares 16 24 26 27 19<br />
Market capitalization, end of year, EUR million 780.9 803.6 1,109.2 1,262.9 741.5<br />
Increase in share capital<br />
Average number of shares (1000) 3) 128,318 128,800 128,800 122,090 120,800<br />
Number of shares at end of year (1000) 3) 127,800 128,800 128,800 128,800 120,800<br />
Increases in number of shares (1000) – – – 8,000 –<br />
Share capital, EUR million 217.0 216.6 216.6 216.6 203.2<br />
Increases in share capital, EUR million – – – 13.5 –<br />
1)<br />
The change in accounting practice (IAS 12) reduced 1998 taxes by EUR 14.0 million.<br />
2)<br />
The <strong>1999</strong> dividend is the Board of Directors’ proposal to the <strong>Annual</strong> General Meeting.<br />
3)<br />
Weighted average number of shares outstanding, adjusted by the number of shares bought back.<br />
16