Annual Report 1999 - Kemira
Annual Report 1999 - Kemira
Annual Report 1999 - Kemira

You also want an ePaper? Increase the reach of your titles
YUMPU automatically turns print PDFs into web optimized ePapers that Google loves.
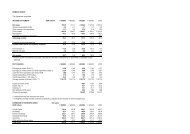
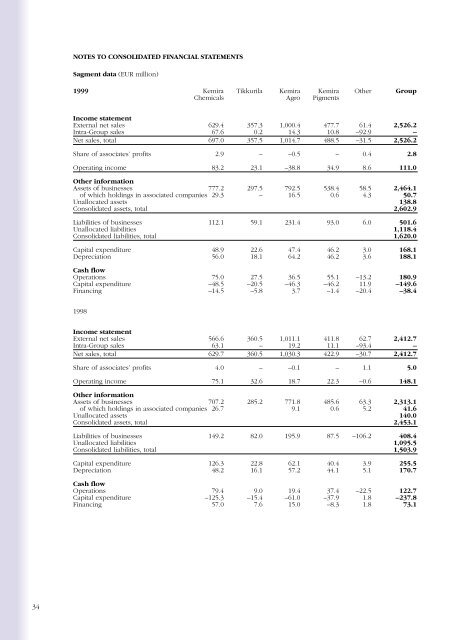
NOTES TO CONSOLIDATED FINANCIAL STATEMENTS<br />
Sagment data (EUR million)<br />
<strong>1999</strong> <strong>Kemira</strong> Tikkurila <strong>Kemira</strong> <strong>Kemira</strong> Other Group<br />
Chemicals Agro Pigments<br />
Income statement<br />
External net sales 629.4 357.3 1,000.4 477.7 61.4 2,526.2<br />
Intra-Group sales 67.6 0.2 14.3 10.8 –92.9 –<br />
Net sales, total 697.0 357.5 1,014.7 488.5 –31.5 2,526.2<br />
Share of associates’ profits 2.9 – –0.5 – 0.4 2.8<br />
Operating income 83.2 23.1 –38.8 34.9 8.6 111.0<br />
Other information<br />
Assets of businesses 777.2 297.5 792.5 538.4 58.5 2,464.1<br />
of which holdings in associated companies 29.3 – 16.5 0.6 4.3 50.7<br />
Unallocated assets 138.8<br />
Consolidated assets, total 2,602.9<br />
Liabilities of businesses 112.1 59.1 231.4 93.0 6.0 501.6<br />
Unallocated liabilities 1,118.4<br />
Consolidated liabilities, total 1,620.0<br />
Capital expenditure 48.9 22.6 47.4 46.2 3.0 168.1<br />
Depreciation 56.0 18.1 64.2 46.2 3.6 188.1<br />
Cash flow<br />
Operations 75.0 27.5 36.5 55.1 –13.2 180.9<br />
Capital expenditure –48.5 –20.5 –46.3 –46.2 11.9 –149.6<br />
Financing –14.5 –5.8 3.7 –1.4 –20.4 –38.4<br />
1998<br />
Income statement<br />
External net sales 566.6 360.5 1,011.1 411.8 62.7 2,412.7<br />
Intra-Group sales 63.1 – 19.2 11.1 –93.4 –<br />
Net sales, total 629.7 360.5 1,030.3 422.9 –30.7 2,412.7<br />
Share of associates’ profits 4.0 – –0.1 – 1.1 5.0<br />
Operating income 75.1 32.6 18.7 22.3 –0.6 148.1<br />
Other information<br />
Assets of businesses 707.2 285.2 771.8 485.6 63.3 2,313.1<br />
of which holdings in associated companies 26.7 9.1 0.6 5.2 41.6<br />
Unallocated assets 140.0<br />
Consolidated assets, total 2,453.1<br />
Liabilities of businesses 149.2 82.0 195.9 87.5 –106.2 408.4<br />
Unallocated liabilities 1,095.5<br />
Consolidated liabilities, total 1,503.9<br />
Capital expenditure 126.3 22.8 62.1 40.4 3.9 255.5<br />
Depreciation 48.2 16.1 57.2 44.1 5.1 170.7<br />
Cash flow<br />
Operations 79.4 9.0 19.4 37.4 –22.5 122.7<br />
Capital expenditure –125.3 –15.4 –61.0 –37.9 1.8 –237.8<br />
Financing 57.0 7.6 15.0 –8.3 1.8 73.1<br />
34