Annual Report 1999 - Kemira
Annual Report 1999 - Kemira
Annual Report 1999 - Kemira

Create successful ePaper yourself
Turn your PDF publications into a flip-book with our unique Google optimized e-Paper software.
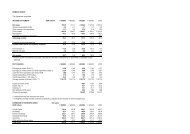
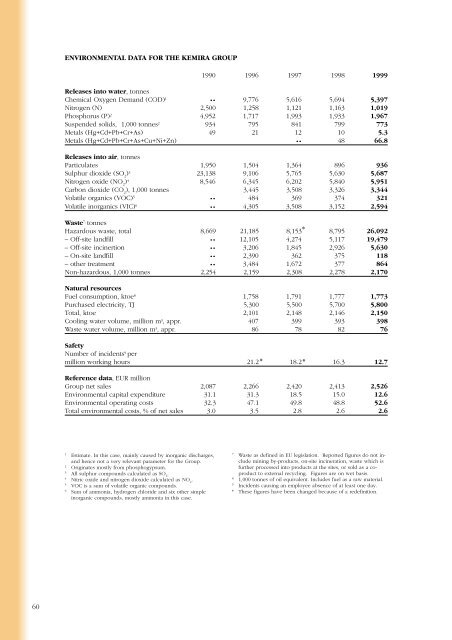
ENVIRONMENTAL DATA FOR THE KEMIRA GROUP<br />
1990 1996 1997 1998 <strong>1999</strong><br />
Releases into water, tonnes<br />
Chemical Oxygen Demand (COD) 1 •• 9,776 5,616 5,694 5,397<br />
Nitrogen (N) 2,500 1,258 1,121 1,163 1,019<br />
Phosphorus (P) 2 4,952 1,717 1,993 1,933 1,967<br />
Suspended solids, 1,000 tonnes 2 934 795 841 799 773<br />
Metals (Hg+Cd+Pb+Cr+As) 49 21 12 10 5.3<br />
Metals (Hg+Cd+Pb+Cr+As+Cu+Ni+Zn) •• 48 66.8<br />
Releases into air, tonnes<br />
Particulates 1,950 1,504 1,364 896 936<br />
Sulphur dioxide (SO 2<br />
) 3 23,138 9,106 5,765 5,630 5,687<br />
Nitrogen oxide (NO 2<br />
) 4 8,546 6,345 6,202 5,840 5,951<br />
Carbon dioxide (CO 2<br />
), 1,000 tonnes 3,445 3,508 3,326 3,344<br />
Volatile organics (VOC) 5 •• 484 369 374 321<br />
Volatile inorganics (VIC) 6 •• 4,305 3,508 3,152 2,594<br />
Waste 7, tonnes<br />
Hazardous waste, total 8,669 21,185 8,153*<br />
8,795 26,092<br />
– Off-site landfill •• 12,105 4,274 5,117 19,479<br />
– Off-site incinertion •• 3,206 1,845 2,926 5,630<br />
– On-site landfill •• 2,390 362 375 118<br />
– other treatment •• 3,484 1,672 377 864<br />
Non-hazardous, 1,000 tonnes 2,254 2,159 2,308 2,278 2,170<br />
Natural resources<br />
Fuel consumption, ktoe 8 1,758 1,791 1,777 1,773<br />
Purchased electricity, TJ 5,300 5,500 5,700 5,800<br />
Total, ktoe 2,101 2,148 2,146 2,150<br />
Cooling water volume, million m 3 , appr. 407 399 393 398<br />
Waste water volume, million m 3 , appr. 86 78 82 76<br />
Safety<br />
Number of incidents 9 per<br />
million working hours 21.2 18.2 16.3 12.7<br />
Reference data, EUR million<br />
Group net sales 2,087 2,266 2,420 2,413 2,526<br />
Environmental capital expenditure 31.1 31.3 18.5 15.0 12.6<br />
Environmental operating costs 32.3 47.1 49.8 48.8 52.6<br />
Total environmental costs, % of net sales 3.0 3.5 2.8 2.6 2.6<br />
*<br />
*<br />
1<br />
Estimate. In this case, mainly caused by inorganic discharges,<br />
and hence not a very relevant parameter for the Group.<br />
2<br />
Originates mostly from phosphogypsum.<br />
3<br />
All sulphur compounds calculated as SO 2<br />
.<br />
4<br />
Nitric oxide and nitrogen dioxide calculated as NO 2<br />
.<br />
5<br />
VOC is a sum of volatile organic compounds.<br />
6<br />
Sum of ammonia, hydrogen chloride and six other simple<br />
inorganic compounds, mostly ammonia in this case.<br />
7<br />
Waste as defined in EU legislation. <strong>Report</strong>ed figures do not include<br />
mining by-products, on-site incineration, waste which is<br />
further processed into products at the sites, or sold as a coproduct<br />
to external recycling. Figures are on wet basis.<br />
8<br />
1,000 tonnes of oil equivalent. Includes fuel as a raw material.<br />
9<br />
Incidents causing an employee absence of at least one day.<br />
* These figures have been changed because of a redefinition.<br />
60