Annual Report 1999 - Kemira
Annual Report 1999 - Kemira
Annual Report 1999 - Kemira

You also want an ePaper? Increase the reach of your titles
YUMPU automatically turns print PDFs into web optimized ePapers that Google loves.
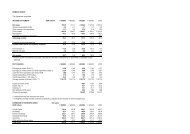
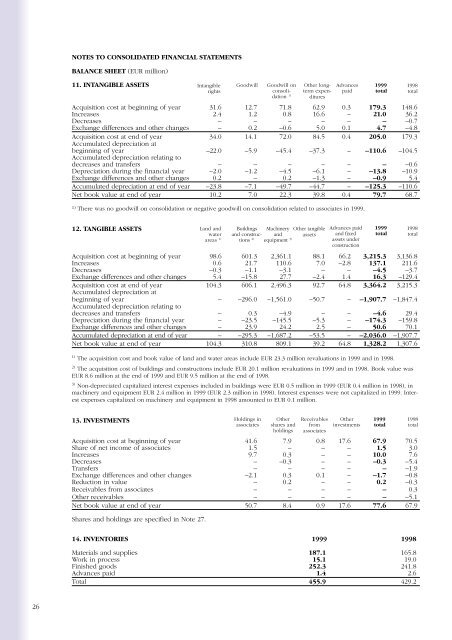
NOTES TO CONSOLIDATED FINANCIAL STATEMENTS<br />
BALANCE SHEET (EUR million)<br />
11. INTANGIBLE ASSETS<br />
Intangible<br />
rights<br />
Goodwill<br />
Goodwill on<br />
consolidation<br />
1)<br />
Other longterm<br />
expenditures<br />
Advances<br />
paid<br />
Acquisition cost at beginning of year 31.6 12.7 71.8 62.9 0.3 179.3 148.6<br />
Increases 2.4 1.2 0.8 16.6 – 21.0 36.2<br />
Decreases – – – – – – –0.7<br />
Exchange differences and other changes – 0.2 –0.6 5.0 0.1 4.7 –4.8<br />
Acquisition cost at end of year 34.0 14.1 72.0 84.5 0.4 205.0 179.3<br />
Accumulated depreciation at<br />
beginning of year –22.0 –5.9 –45.4 –37.3 – –110.6 –104.5<br />
Accumulated depreciation relating to<br />
decreases and transfers – – – – – – –0.6<br />
Depreciation during the financial year –2.0 –1.2 –4.5 –6.1 – –13.8 –10.9<br />
Exchange differences and other changes 0.2 – 0.2 –1.3 – –0.9 5.4<br />
Accumulated depreciation at end of year –23.8 –7.1 –49.7 –44.7 – –125.3 –110.6<br />
Net book value at end of year 10.2 7.0 22.3 39.8 0.4 79.7 68.7<br />
1) There was no goodwill on consolidation or negative goodwill on consolidation related to associates in <strong>1999</strong>.<br />
<strong>1999</strong><br />
total<br />
1998<br />
total<br />
12. TANGIBLE ASSETS<br />
Land and<br />
water<br />
areas 1)<br />
Buildings<br />
and constructions<br />
2)<br />
Machinery<br />
and<br />
equipment 3)<br />
Other tangible<br />
assets<br />
Advances paid<br />
and fixed<br />
assets under<br />
construction<br />
Acquisition cost at beginning of year 98.6 601.3 2,361.1 88.1 66.2 3,215.3 3,136.8<br />
Increases 0.6 21.7 110.6 7.0 –2.8 137.1 211.6<br />
Decreases –0.3 –1.1 –3.1 – – –4.5 –3.7<br />
Exchange differences and other changes 5.4 –15.8 27.7 –2.4 1.4 16.3 –129.4<br />
Acquisition cost at end of year 104.3 606.1 2,496.3 92.7 64.8 3,364.2 3,215.3<br />
Accumulated depreciation at<br />
beginning of year – –296.0 –1,561.0 –50.7 – –1,907.7 –1,847.4<br />
Accumulated depreciation relating to<br />
decreases and transfers – 0.3 –4.9 – – –4.6 29.4<br />
Depreciation during the financial year – –23.5 –145.5 –5.3 – –174.3 –159.8<br />
Exchange differences and other changes – 23.9 24.2 2.5 – 50.6 70.1<br />
Accumulated depreciation at end of year – –295.3 –1,687.2 –53.5 – –2,036.0 –1,907.7<br />
Net book value at end of year 104.3 310.8 809.1 39.2 64.8 1,328.2 1,307.6<br />
1)<br />
The acquisition cost and book value of land and water areas include EUR 23.3 million revaluations in <strong>1999</strong> and in 1998.<br />
2)<br />
The acquisition cost of buildings and constructions include EUR 20.1 million revaluations in <strong>1999</strong> and in 1998. Book value was<br />
EUR 8.6 million at the end of <strong>1999</strong> and EUR 9.5 million at the end of 1998.<br />
3)<br />
Non-depreciated capitalized interest expenses included in buildings were EUR 0.5 million in <strong>1999</strong> (EUR 0.4 million in 1998), in<br />
machinery and equipment EUR 2.4 million in <strong>1999</strong> (EUR 2.3 million in 1998). Interest expenses were not capitalized in <strong>1999</strong>. Interest<br />
expenses capitalized on machinery and equipment in 1998 amounted to EUR 0.1 million.<br />
<strong>1999</strong><br />
total<br />
1998<br />
total<br />
13. INVESTMENTS<br />
Acquisition cost at beginning of year 41.6 7.9 0.8 17.6 67.9 70.5<br />
Share of net income of associates 1.5 – – – 1.5 3.0<br />
Increases 9.7 0.3 – – 10.0 7.6<br />
Decreases – –0.3 – – –0.3 –5.4<br />
Transfers – – – – – –1.9<br />
Exchange differences and other changes –2.1 0.3 0.1 – –1.7 –0.8<br />
Reduction in value – 0.2 – – 0.2 –0.3<br />
Receivables from associates – – – – – 0.3<br />
Other receivables – – – – – –5.1<br />
Net book value at end of year 50.7 8.4 0.9 17.6 77.6 67.9<br />
Shares and holdings are specified in Note 27.<br />
Holdings in<br />
associates<br />
Other<br />
shares and<br />
holdings<br />
Receivables<br />
from<br />
associates<br />
Other<br />
investments<br />
<strong>1999</strong><br />
total<br />
1998<br />
total<br />
14. INVENTORIES <strong>1999</strong> 1998<br />
Materials and supplies 187.1 165.8<br />
Work in process 15.1 19.0<br />
Finished goods 252.3 241.8<br />
Advances paid 1.4 2.6<br />
Total 455.9 429.2<br />
26