Annual Report 1999 - Kemira
Annual Report 1999 - Kemira
Annual Report 1999 - Kemira

You also want an ePaper? Increase the reach of your titles
YUMPU automatically turns print PDFs into web optimized ePapers that Google loves.
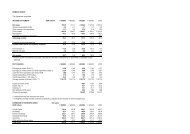
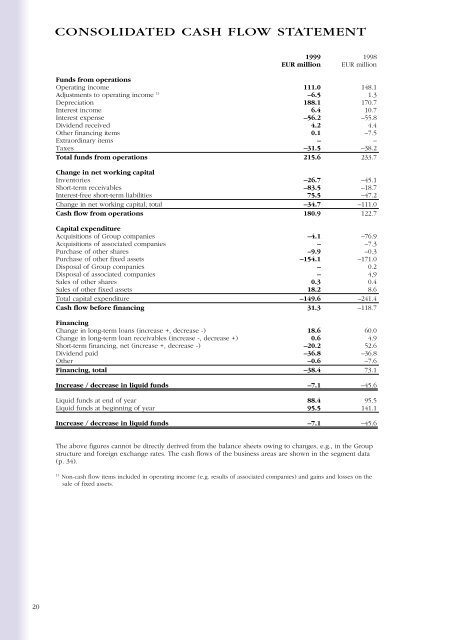
CONSOLIDATED CASH FLOW STATEMENT<br />
<strong>1999</strong> 1998<br />
EUR million EUR million<br />
Funds from operations<br />
Operating income 111.0 148.1<br />
Adjustments to operating income 1) –6.5 1.3<br />
Depreciation 188.1 170.7<br />
Interest income 6.4 10.7<br />
Interest expense –56.2 –55.8<br />
Dividend received 4.2 4.4<br />
Other financing items 0.1 –7.5<br />
Extraordinary items – –<br />
Taxes –31.5 –38.2<br />
Total funds from operations 215.6 233.7<br />
Change in net working capital<br />
Inventories –26.7 –45.1<br />
Short-term receivables –83.5 –18.7<br />
Interest-free short-term liabilities 75.5 –47.2<br />
Change in net working capital, total –34.7 –111.0<br />
Cash flow from operations 180.9 122.7<br />
Capital expenditure<br />
Acquisitions of Group companies –4.1 –76.9<br />
Acquisitions of associated companies – –7.3<br />
Purchase of other shares –9.9 –0.3<br />
Purchase of other fixed assets –154.1 –171.0<br />
Disposal of Group companies – 0.2<br />
Disposal of associated companies – 4,9<br />
Sales of other shares 0.3 0.4<br />
Sales of other fixed assets 18.2 8.6<br />
Total capital expenditure –149.6 –241.4<br />
Cash flow before financing 31.3 –118.7<br />
Financing<br />
Change in long-term loans (increase +, decrease -) 18.6 60.0<br />
Change in long-term loan receivables (increase -, decrease +) 0.6 4.9<br />
Short-term financing, net (increase +, decrease -) –20.2 52.6<br />
Dividend paid –36.8 –36.8<br />
Other –0.6 –7.6<br />
Financing, total –38.4 73.1<br />
Increase / decrease in liquid funds –7.1 –45.6<br />
Liquid funds at end of year 88.4 95.5<br />
Liquid funds at beginning of year 95.5 141.1<br />
Increase / decrease in liquid funds –7.1 –45.6<br />
The above figures cannot be directly derived from the balance sheets owing to changes, e.g., in the Group<br />
structure and foreign exchange rates. The cash flows of the business areas are shown in the segment data<br />
(p. 34).<br />
1)<br />
Non-cash flow items included in operating income (e.g. results of associated companies) and gains and losses on the<br />
sale of fixed assets.<br />
20