Annual Report 1999 - Kemira
Annual Report 1999 - Kemira
Annual Report 1999 - Kemira

Create successful ePaper yourself
Turn your PDF publications into a flip-book with our unique Google optimized e-Paper software.
KEMIRA CHEMICALS<br />
EUR<br />
million<br />
800<br />
600<br />
400<br />
200<br />
0<br />
MANAGEMENT<br />
President: Yrjö Sipilä<br />
Pulp & Paper Chemicals:<br />
Juhani Lindholm<br />
Kemwater: Lennart Johansson<br />
Industrial Chemicals:<br />
Harri Kerminen<br />
Yrjö<br />
Sipilä<br />
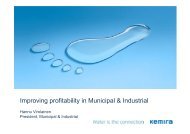
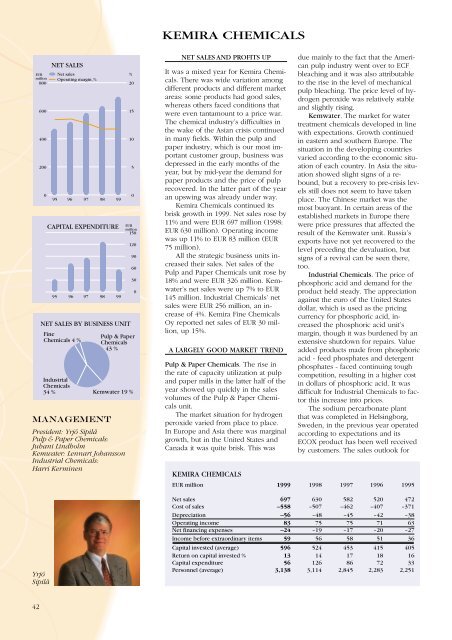
NET SALES<br />
Net sales<br />
Operating margin, %<br />
95 96 97 98 99<br />
CAPITAL EXPENDITURE<br />
95 96 97 98 99<br />
NET SALES BY BUSINESS UNIT<br />
Fine<br />
Chemicals 4 %<br />
Industrial<br />
Chemicals<br />
34 %<br />
%<br />
20<br />
15<br />
10<br />
5<br />
0<br />
EUR<br />
million<br />
150<br />
120<br />
90<br />
60<br />
30<br />
Pulp & Paper<br />
Chemicals<br />
43 %<br />
Kemwater 19 %<br />
0<br />
NET SALES AND PROFITS UP<br />
It was a mixed year for <strong>Kemira</strong> Chemicals.<br />
There was wide variation among<br />
different products and different market<br />
areas: some products had good sales,<br />
whereas others faced conditions that<br />
were even tantamount to a price war.<br />
The chemical industry’s difficulties in<br />
the wake of the Asian crisis continued<br />
in many fields. Within the pulp and<br />
paper industry, which is our most important<br />
customer group, business was<br />
depressed in the early months of the<br />
year, but by mid-year the demand for<br />
paper products and the price of pulp<br />
recovered. In the latter part of the year<br />
an upswing was already under way.<br />
<strong>Kemira</strong> Chemicals continued its<br />
brisk growth in <strong>1999</strong>. Net sales rose by<br />
11% and were EUR 697 million (1998:<br />
EUR 630 million). Operating income<br />
was up 11% to EUR 83 million (EUR<br />
75 million).<br />
All the strategic business units increased<br />
their sales. Net sales of the<br />
Pulp and Paper Chemicals unit rose by<br />
18% and were EUR 326 million. Kemwater’s<br />
net sales were up 7% to EUR<br />
145 million. Industrial Chemicals’ net<br />
sales were EUR 256 million, an increase<br />
of 4%. <strong>Kemira</strong> Fine Chemicals<br />
Oy reported net sales of EUR 30 million,<br />
up 15%.<br />
A LARGELY GOOD MARKET TREND<br />
Pulp & Paper Chemicals. The rise in<br />
the rate of capacity utilization at pulp<br />
and paper mills in the latter half of the<br />
year showed up quickly in the sales<br />
volumes of the Pulp & Paper Chemicals<br />
unit.<br />
The market situation for hydrogen<br />
peroxide varied from place to place.<br />
In Europe and Asia there was marginal<br />
growth, but in the United States and<br />
Canada it was quite brisk. This was<br />
due mainly to the fact that the American<br />
pulp industry went over to ECF<br />
bleaching and it was also attributable<br />
to the rise in the level of mechanical<br />
pulp bleaching. The price level of hydrogen<br />
peroxide was relatively stable<br />
and slightly rising.<br />
Kemwater. The market for water<br />
treatment chemicals developed in line<br />
with expectations. Growth continued<br />
in eastern and southern Europe. The<br />
situation in the developing countries<br />
varied according to the economic situation<br />
of each country. In Asia the situation<br />
showed slight signs of a rebound,<br />
but a recovery to pre-crisis levels<br />
still does not seem to have taken<br />
place. The Chinese market was the<br />
most buoyant. In certain areas of the<br />
established markets in Europe there<br />
were price pressures that affected the<br />
result of the Kemwater unit. Russia’s<br />
exports have not yet recovered to the<br />
level preceding the devaluation, but<br />
signs of a revival can be seen there,<br />
too.<br />
Industrial Chemicals. The price of<br />
phosphoric acid and demand for the<br />
product held steady. The appreciation<br />
against the euro of the United States<br />
dollar, which is used as the pricing<br />
currency for phosphoric acid, increased<br />
the phosphoric acid unit’s<br />
margin, though it was burdened by an<br />
extensive shutdown for repairs. Value<br />
added products made from phosphoric<br />
acid - feed phosphates and detergent<br />
phosphates - faced continuing tough<br />
competition, resulting in a higher cost<br />
in dollars of phosphoric acid. It was<br />
difficult for Industrial Chemicals to factor<br />
this increase into prices.<br />
The sodium percarbonate plant<br />
that was completed in Helsingborg,<br />
Sweden, in the previous year operated<br />
according to expectations and its<br />
ECOX product has been well received<br />
by customers. The sales outlook for<br />
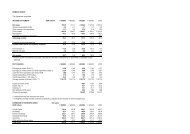
KEMIRA CHEMICALS<br />
EUR million <strong>1999</strong> 1998 1997 1996 1995<br />
Net sales 697 630 582 520 472<br />
Cost of sales –558 –507 –462 –407 –371<br />
Depreciation –56 –48 –45 –42 –38<br />
Operating income 83 75 75 71 63<br />
Net financing expenses –24 –19 –17 –20 –27<br />
Income before extraordinary items 59 56 58 51 36<br />
Capital invested (average) 596 524 453 415 405<br />
Return on capital invested % 13 14 17 18 16<br />
Capital expenditure 56 126 86 72 33<br />
Personnel (average) 3,138 3,114 2,845 2,283 2,251<br />
42