Annual Report 1999 - Kemira
Annual Report 1999 - Kemira
Annual Report 1999 - Kemira

You also want an ePaper? Increase the reach of your titles
YUMPU automatically turns print PDFs into web optimized ePapers that Google loves.
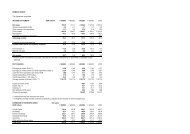
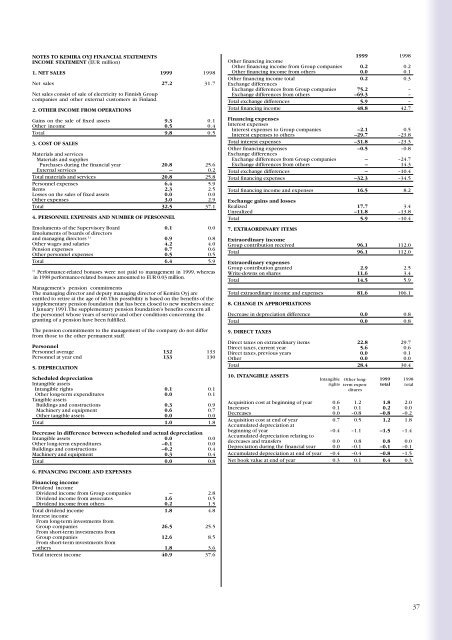
NOTES TO KEMIRA OYJ FINANCIAL STATEMENTS<br />
INCOME STATEMENT (EUR million)<br />
1. NET SALES <strong>1999</strong> 1998<br />
Net sales 27.2 31.7<br />
Net sales consist of sale of electricity to Finnish Group<br />
companies and other external customers in Finland.<br />
2. OTHER INCOME FROM OPERATIONS<br />
Gains on the sale of fixed assets 9.3 0.1<br />
Other income 0.5 0.4<br />
Total 9.8 0.5<br />
3. COST OF SALES<br />
Materials and services<br />
Materials and supplies<br />
Purchases during the financial year 20.8 25.6<br />
External services – 0.2<br />
Total materials and services 20.8 25.8<br />
Personnel expenses 6.4 5.9<br />
Rents 2.3 2.5<br />
Losses on the sales of fixed assets 0.0 0.0<br />
Other expenses 3.0 2.9<br />
Total 32.5 37.1<br />
4. PERSONNEL EXPENSES AND NUMBER OF PERSONNEL<br />
Emoluments of the Supervisory Board 0.1 0.0<br />
Emoluments of boards of directors<br />
and managing directors 1) 0.9 0.8<br />
Other wages and salaries 4.2 4.0<br />
Pension expenses 0.7 0.6<br />
Other personnel expenses 0.5 0.5<br />
Total 6.4 5.9<br />
1)<br />
Performance-related bonuses were not paid to management in <strong>1999</strong>, whereas<br />
in 1998 performance-related bonuses amounted to EUR 0.03 million.<br />
Management’s pension commitments<br />
The managing director and deputy managing director of <strong>Kemira</strong> Oyj are<br />
entitled to retire at the age of 60. This possibility is based on the benefits of the<br />
supplementary pension foundation that has been closed to new menbers since<br />
1 January 1991. The supplementary pension foundation’s benefits concern all<br />
the personnel whose years of service and other conditions concerning the<br />
granting of a pension have been fulfilled.<br />
The pension commitments to the management of the company do not differ<br />
from those to the other permanent staff.<br />
Personnel<br />
Personnel average 132 133<br />
Personnel at year end 133 130<br />
5. DEPRECIATION<br />
Scheduled depreciation<br />
Intangible assets<br />
Intangible rights 0.1 0.1<br />
Other long-term expenditures 0.0 0.1<br />
Tangible assets<br />
Buildings and constructions 0.3 0.9<br />
Machinery and equipment 0.6 0.7<br />
Other tangible assets 0.0 0.0<br />
Total 1.0 1.8<br />
Decrease in difference between scheduled and actual depreciation<br />
Intangible assets 0.0 0.0<br />
Other long-term expenditures –0.1 0.0<br />
Buildings and constructions –0.2 0.4<br />
Machinery and equipment 0.3 0.4<br />
Total 0.0 0.8<br />
6. FINANCING INCOME AND EXPENSES<br />
Financing income<br />
Dividend income<br />
Dividend income from Group companies – 2.8<br />
Dividend income from associates 1.6 0.5<br />
Dividend income from others 0.2 1.5<br />
Total dividend income 1.8 4.8<br />
Interest income<br />
From long-term investments from<br />
Group companies 26.5 25.5<br />
From short-term investments from<br />
Group companies 12.6 8.5<br />
From short-term investments from<br />
others 1.8 3.6<br />
Total interest income 40.9 37.6<br />
<strong>1999</strong> 1998<br />
Other financing income<br />
Other financing income from Group companies 0.2 0.2<br />
Other financing income from others 0.0 0.1<br />
Other financing income total 0.2 0.3<br />
Exchange differences<br />
Exchange differences from Group companies 75.2 –<br />
Exchange differences from others –69.3 –<br />
Total exchange differences 5.9 –<br />
Total financing income 48.8 42.7<br />
Financing expenses<br />
Interest expenses<br />
Interest expenses to Group companies –2.1 0.5<br />
Interest expenses to others –29.7 –23.8<br />
Total interest expenses –31.8 –23.3<br />
Other financing expenses –0.5 –0.8<br />
Exchange differences<br />
Exchange differences from Group companies – –24.7<br />
Exchange differences from others – 14.3<br />
Total exchange differences – –10.4<br />
Total financing expenses –32.3 –34.5<br />
Total financing income and expenses 16.5 8.2<br />
Exchange gains and losses<br />
Realized 17.7 3.4<br />
Unrealized –11.8 –13.8<br />
Total 5.9 –10.4<br />
7. EXTRAORDINARY ITEMS<br />
Extraordinary income<br />
Group contribution received 96.1 112.0<br />
Total 96.1 112.0<br />
Extraordinary expenses<br />
Group contribution granted 2.9 2.5<br />
Write-downs on shares 11.6 3.4<br />
Total 14.5 5.9<br />
Total extraordinary income and expenses 81.6 106.1<br />
8. CHANGE IN APPROPRIATIONS<br />
Decrease in depreciation difference 0.0 0.8<br />
Total 0.0 0.8<br />
9. DIRECT TAXES<br />
Direct taxes on extraordinary items 22.8 29.7<br />
Direct taxes, current year 5.6 0.6<br />
Direct taxes, previous years 0.0 0.1<br />
Other 0.0 0.0<br />
Total 28.4 30.4<br />
10. INTANGIBLE ASSETS<br />
Intangible Other longterm<br />
<strong>1999</strong> 1998<br />
rights<br />
expen-<br />
total total<br />
ditures<br />
Acquisition cost at beginning of year 0.6 1.2 1.8 2.0<br />
Increases 0.1 0.1 0.2 0.0<br />
Decreases 0.0 –0.8 –0.8 –0.2<br />
Acquisition cost at end of year 0.7 0.5 1.2 1.8<br />
Accumulated depreciation at<br />
beginning of year –0.4 –1.1 –1.5 –1.4<br />
Accumulated depreciation relating to<br />
decreases and transfers 0.0 0.8 0.8 0.0<br />
Depreciation during the financial year 0.0 –0.1 –0.1 –0.1<br />
Accumulated depreciation at end of year –0.4 –0.4 –0.8 –1.5<br />
Net book value at end of year 0.3 0.1 0.4 0.3<br />
37