Annual Report 1999 - Kemira
Annual Report 1999 - Kemira
Annual Report 1999 - Kemira

Create successful ePaper yourself
Turn your PDF publications into a flip-book with our unique Google optimized e-Paper software.
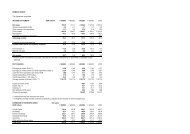
DEFINITIONS OF KEY RATIOS<br />
PER-SHARE DATA<br />
Earnings per share (EPS)<br />
Income before extraordinary items +/– minority interest<br />
– taxes<br />
Adjusted average number of shares<br />
Net income per share<br />
Net income<br />
Adjusted average number of shares<br />
Cash flow from operations<br />
Cash flow from operations, after change in net working<br />
capital and before capital investments<br />
Cash flow from operations per share<br />
Cash flow from operations<br />
Adjusted average number of shares<br />
Dividend per share<br />
Dividends paid<br />
Number of shares at end of year<br />
Dividend payout ratio<br />
Dividend per share x 100<br />
Earnings per share<br />
Dividend yield<br />
Dividend per share x 100<br />
Share price at end of year<br />
Equity per share<br />
Equity at end of year<br />
Number of shares at end of year<br />
FINANCIAL RATIOS<br />
Net liabilities<br />
Interest-bearing liabilities – cash and bank – securities<br />
Equity ratio, %<br />
Shareholders’ equity + minority interest x 100<br />
Total assets – advance payments received<br />
Gearing, %<br />
Net liabilities x 100<br />
Shareholders’ equity + minority interest<br />
Interest cover<br />
Operating income + depreciation<br />
Net financial expenses<br />
Return on capital invested, % (ROI)<br />
Income before extraordinary items + interest expenses +<br />
other financing expenses x 100<br />
Total assets – interest-free liabilities<br />
(average)<br />
Return on equity, % (ROE)<br />
Income before extraordinary items – taxes<br />
Shareholders’ equity + minority interests<br />
(average)<br />
Cash flow return on capital invested (CFROI), %<br />
Cash flow from operations x 100<br />
Total assets – interest-free liabilities<br />
(average)<br />
Share price, year average<br />
Shares traded (EUR)<br />
Shares traded (volume)<br />
Share price, end of year<br />
Weighted average share price of the last trading day<br />
Price per earnings per share (P / E)<br />
Share price at end of year<br />
Earnings per share<br />
Price per equity per share<br />
Share price at end of year<br />
Equity per share<br />
Price per cash flow per share<br />
Share price at end of year<br />
Cash flow from operations per share<br />
Share turnover<br />
Number of shares traded during the year and the proportional<br />
share of number of shares traded to weighted average number<br />
of shares during the year<br />
15