Annual Report 1999 - Kemira
Annual Report 1999 - Kemira
Annual Report 1999 - Kemira

Create successful ePaper yourself
Turn your PDF publications into a flip-book with our unique Google optimized e-Paper software.
TIKKURILA<br />
Tikkurila’s net sales fell 1% short of the<br />
previous year’s figure and were EUR 357<br />
million (361 million in 1998). Sales of<br />
decorative paints in Finland were brisker<br />
than last year, whereas the economic crisis<br />
in Russia still kept sales volumes<br />
small. Worldwide sales of colorants grew<br />
further, but this was offset by the sales<br />
of tinting machines, which were markedly<br />
smaller than they were a year earlier.<br />
Operating income was EUR 23 million<br />
(33 million in 1998), or 6% of net<br />
sales. Operating income in the September-December<br />
period was EUR 1.6 million,<br />
compared with an operating loss of<br />
0.8 million in the same period a year<br />
earlier. Credit loss provisions primarily<br />
for receivables from Russia were booked<br />
in a total amount of EUR 3.1 million, of<br />
which about a quarter came in the last<br />
three-month period.<br />
The control system of Tikkurila’s<br />
Monicolor plant in Vantaa was renewed<br />
and at the same time production capacity<br />
was raised significantly. In the vicinity<br />
of Moscow, construction work got started<br />
on a second paint plant that Tikkurila<br />
will operate in Russia. The target is to<br />
start production in the first half of this<br />
year. Deliveries by the company’s plants<br />
in St Petersburg picked up towards the<br />
end of the year. In Western Europe testing<br />
of a new marketing concept was<br />
started during the year in co-operation<br />
with the Italian company Benetton.<br />
A colorant plant was completed in<br />
Singapore towards the end of the year.<br />
In China too a unit that will manufacture<br />
components for colour processing systems<br />
will be built.<br />
In line with the new strategic focus,<br />
the Group’s objective is to promote the<br />
growth potential of the paint business by<br />
divesting Tikkurila CPS either entirely or<br />
in part.<br />
KEMIRA AGRO<br />
<strong>Kemira</strong> Agro’s net sales declined by 2%<br />
and were EUR 1,015 million. The volume<br />
of sales in Western Europe was at<br />
the previous year’s level. Overseas exports<br />
outside Europe grew significantly,<br />
up 35% on the previous year. On the<br />
other hand, the plant nutrient markets in<br />
Finland’s nearby areas in the Baltic<br />
countries and Poland were in decline.<br />
Prices of plant nutrients fell further,<br />
by 5-15%, particularly within nitrogen<br />
fertilizers in Western Europe and they<br />
ended at an all-time low level. New capacity,<br />
the cost advantage which Russian<br />
nitrogen products enjoy owing to cheap<br />
natural gas, and China’s absence as a<br />
purchaser of nitrogen products have all<br />
been factors keeping prices of these<br />
products low. At present it nevertheless<br />
appears that prices bottomed out towards<br />
the end of the year. Owing to the<br />
risks posed by the East European countries<br />
and the Baltic area, credit loss provisions<br />
were increased by total of EUR 6<br />
million.<br />
The fall in the prices and sales volume<br />
of plant nutrients was reflected in<br />
the company’s operating income, which<br />
fell significantly and was a loss of EUR<br />
39 million. In the September-December<br />
period operating income was EUR 37<br />
million negative, whereas a year earlier<br />
it was EUR 19 million negative. Operating<br />
income in the last four months of the<br />
year includes a total of EUR 23 million<br />
of non-recurring costs that are mainly<br />
connected with the company’s structural<br />
change.<br />
In line with the Group’s strategic<br />
policy, <strong>Kemira</strong> Agro will focus on speciality<br />
fertilizers and withdraw from the nitrogen<br />
fertilizer business either in part or<br />
totally. In anticipation of this change, the<br />
company’s organization was divided into<br />
two parts in January 2000: the speciality<br />
fertilizer business and the nitrogen fertilizer<br />
business.<br />
NPK fertilizer production was wound<br />
up at Pernis in the Netherlands and<br />
plans call for also closing the phosphoric<br />
acid, sulphuric acid and MAP/DAP phosphorus<br />
fertilizer plants in the summer of<br />
this year. <strong>Kemira</strong> Agro booked a total of<br />
EUR 39 million of non-recurring costs for<br />
the past financial year, the bulk of which<br />
was related to the arrangements at<br />
Pernis.<br />
In accordance with the memorandum<br />
of intent that was signed in the previous<br />
year, <strong>Kemira</strong> Agro established a<br />
joint venture that will manufacture potassium<br />
nitrate, which is a speciality fertilizer,<br />
and dicalcium phosphate, a raw<br />
material used in feeds, in Jordan. The<br />
capital project, which is to be completed<br />
in 2002, is based on local raw materials<br />
and <strong>Kemira</strong>-developed cost-effective<br />
technology.<br />
In Italy, <strong>Kemira</strong> Agro acquired a 50%<br />
interest in Biolchim S.p.A, which markets<br />
horticultural fertilizers. A joint venture<br />
that will manufacture urea phosphate<br />
was established in the United Arab<br />
Emirates. The new company will build a<br />
new plant in Dubai with the objective of<br />
starting production by the end of 2000.<br />
The joint ventures in Dubai, Jordan<br />
and Italy will enable <strong>Kemira</strong> Agro to expand<br />
its operations, according to its specialization<br />
strategy, in the irrigation fertilizer<br />
markets in the Mediterranean countries<br />
as well as in the Middle East and<br />
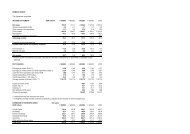
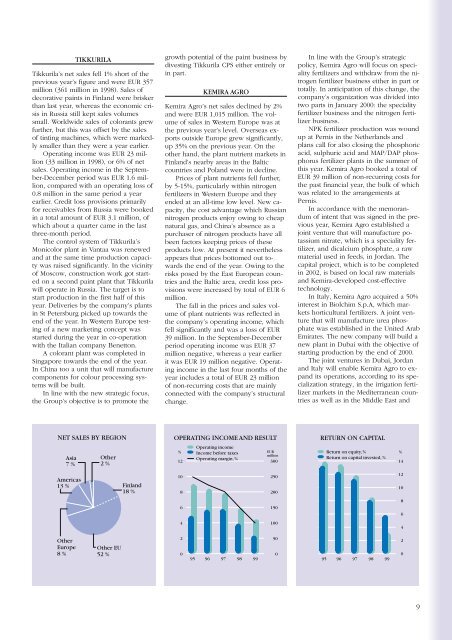
NET SALES BY REGION<br />
OPERATING INCOME AND RESULT<br />
RETURN ON CAPITAL<br />
Asia<br />
7 %<br />
Other<br />
2 %<br />
%<br />
12<br />
Operating income<br />
Income before taxes<br />
Operating margin, %<br />
EUR<br />
million<br />
300<br />
Return on equity, %<br />
Return on capital invested, %<br />
%<br />
14<br />
Americas<br />
13 % Finland<br />
18 %<br />
10<br />
8<br />
250<br />
200<br />
12<br />
10<br />
6<br />
150<br />
8<br />
6<br />
4<br />
100<br />
4<br />
Other<br />
Europe<br />
8 %<br />
Other EU<br />
52 %<br />
2<br />
0<br />
95 96 97 98 99<br />
50<br />
0<br />
95 96 97 98 99<br />
2<br />
0<br />
9