programma & abstracts - Nederlandse Vereniging voor Radiologie
programma & abstracts - Nederlandse Vereniging voor Radiologie
programma & abstracts - Nederlandse Vereniging voor Radiologie

You also want an ePaper? Increase the reach of your titles
YUMPU automatically turns print PDFs into web optimized ePapers that Google loves.
Abdominale radiologie 1 1<br />
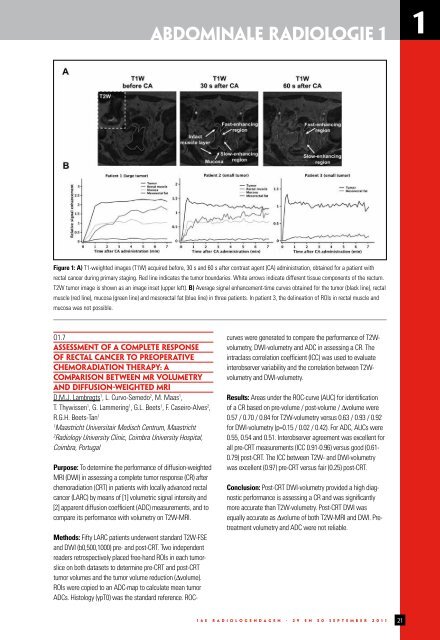
Figure 1: A) T1-weighted images (T1W) acquired before, 30 s and 60 s after contrast agent (CA) administration, obtained for a patient with<br />
rectal cancer during primary staging. Red line indicates the tumor boundaries. White arrows indicate different tissue components of the rectum.<br />
T2W tumor image is shown as an image inset (upper left). B) Average signal enhancement-time curves obtained for the tumor (black line), rectal<br />
muscle (red line), mucosa (green line) and mesorectal fat (blue line) in three patients. In patient 3, the delineation of ROIs in rectal muscle and<br />
mucosa was not possible.<br />
O1.7<br />
ASSESSMENT OF A COMPLETE RESPONSE<br />
OF RECTAL CANCER TO PREOPERATIVE<br />
CHEMORADIATION THERAPY: A<br />
COMPARISON BETWEEN MR VOLUMETRY<br />
AND DIFFUSION-WEIGHTED MRI<br />
D.M.J. Lambregts 1 , L. Curvo-Semedo 2 , M. Maas 1 ,<br />
T. Thywissen 1 , G. Lammering 1 , G.L. Beets 1 , F. Caseiro-Alves 2 ,<br />
R.G.H. Beets-Tan 1<br />
1<br />
Maastricht Universitair Medisch Centrum, Maastricht<br />
2<br />
Radiology University Clinic, Coimbra University Hospital,<br />
Coimbra, Portugal<br />
Purpose: To determine the performance of diffusion-weighted<br />
MRI (DWI) in assessing a complete tumor response (CR) after<br />
chemoradiation (CRT) in patients with locally advanced rectal<br />
cancer (LARC) by means of [1] volumetric signal intensity and<br />
[2] apparent diffusion coefficient (ADC) measurements, and to<br />
compare its performance with volumetry on T2W-MRI.<br />
Methods: Fifty LARC patients underwent standard T2W-FSE<br />
and DWI (b0,500,1000) pre- and post-CRT. Two independent<br />
readers retrospectively placed free-hand ROIs in each tumorslice<br />
on both datasets to determine pre-CRT and post-CRT<br />
tumor volumes and the tumor volume reduction (∆volume).<br />
ROIs were copied to an ADC-map to calculate mean tumor<br />
ADCs. Histology (ypT0) was the standard reference. ROCcurves<br />
were generated to compare the performance of T2Wvolumetry,<br />
DWI-volumetry and ADC in assessing a CR. The<br />
intraclass correlation coefficient (ICC) was used to evaluate<br />
interobserver variability and the correlation between T2Wvolumetry<br />
and DWI-volumetry.<br />
Results: Areas under the ROC-curve (AUC) for identification<br />
of a CR based on pre-volume / post-volume / ∆volume were<br />
0.57 / 0.70 / 0.84 for T2W-volumetry versus 0.63 / 0.93 / 0.92<br />
for DWI-volumetry (p=0.15 / 0.02 / 0.42). For ADC, AUCs were<br />
0.55, 0.54 and 0.51. Interobserver agreement was excellent for<br />
all pre-CRT measurements (ICC 0.91-0.96) versus good (0.61-<br />
0.79) post-CRT. The ICC between T2W- and DWI-volumetry<br />
was excellent (0.97) pre-CRT versus fair (0.25) post-CRT.<br />
Conclusion: Post-CRT DWI-volumetry provided a high diagnostic<br />
performance is assessing a CR and was significantly<br />
more accurate than T2W-volumetry. Post-CRT DWI was<br />
equally accurate as ∆volume of both T2W-MRI and DWI. Pretreatment<br />
volumetry and ADC were not reliable.<br />
1 6 E R A D I O L O G E N D A G E N - 2 9 e n 3 0 S E P T E M B E R 2 0 1 1 21