ENERGY FOR A SUSTAINABLE WORLD - World Resources Institute
ENERGY FOR A SUSTAINABLE WORLD - World Resources Institute
ENERGY FOR A SUSTAINABLE WORLD - World Resources Institute
Create successful ePaper yourself
Turn your PDF publications into a flip-book with our unique Google optimized e-Paper software.
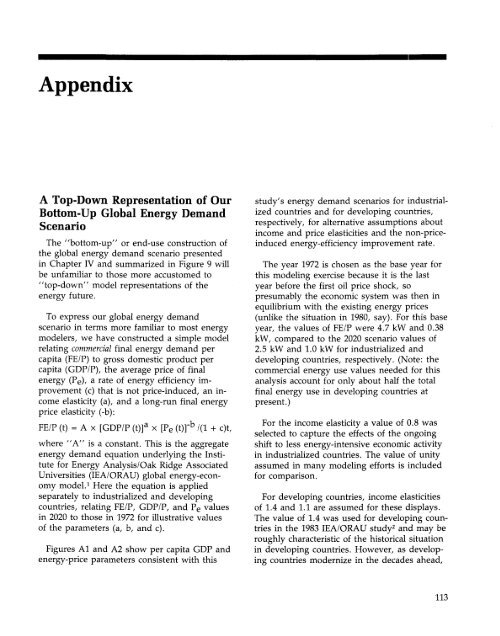
Appendix<br />
A Top-Down Representation of Our<br />
Bottom-Up Global Energy Demand<br />
Scenario<br />
The "bottom-up" or end-use construction of<br />
the global energy demand scenario presented<br />
in Chapter IV and summarized in Figure 9 will<br />
be unfamiliar to those more accustomed to<br />
"top-down" model representations of the<br />
energy future.<br />
To express our global energy demand<br />
scenario in terms more familiar to most energy<br />
modelers, we have constructed a simple model<br />
relating commercial final energy demand per<br />
capita (FE/P) to gross domestic product per<br />
capita (GDP/P), the average price of final<br />
energy (P e ), a rate of energy efficiency improvement<br />
(c) that is not price-induced, an income<br />
elasticity (a), and a long-run final energy<br />
price elasticity (-b):<br />
FE/P (t) = A x [GDP/P (t)] a x [P e (t)]' b /(I + c)t,<br />
where "A" is a constant. This is the aggregate<br />
energy demand equation underlying the <strong>Institute</strong><br />
for Energy Analysis/Oak Ridge Associated<br />
Universities (IEA/ORAU) global energy-economy<br />
model. 1 Here the equation is applied<br />
separately to industrialized and developing<br />
countries, relating FE/P, GDP/P, and P e values<br />
in 2020 to those in 1972 for illustrative values<br />
of the parameters (a, b, and c).<br />
Figures Al and A2 show per capita GDP and<br />
energy-price parameters consistent with this<br />
study's energy demand scenarios for industrialized<br />
countries and for developing countries,<br />
respectively, for alternative assumptions about<br />
income and price elasticities and the non-priceinduced<br />
energy-efficiency improvement rate.<br />
The year 1972 is chosen as the base year for<br />
this modeling exercise because it is the last<br />
year before the first oil price shock, so<br />
presumably the economic system was then in<br />
equilibrium with the existing energy prices<br />
(unlike the situation in 1980, say). For this base<br />
year, the values of FE/P were 4.7 kW and 0.38<br />
kW, compared to the 2020 scenario values of<br />
2.5 kW and 1.0 kW for industrialized and<br />
developing countries, respectively. (Note: the<br />
commercial energy use values needed for this<br />
analysis account for only about half the total<br />
final energy use in developing countries at<br />
present.)<br />
For the income elasticity a value of 0.8 was<br />
selected to capture the effects of the ongoing<br />
shift to less energy-intensive economic activity<br />
in industrialized countries. The value of unity<br />
assumed in many modeling efforts is included<br />
for comparison.<br />
For developing countries, income elasticities<br />
of 1.4 and 1.1 are assumed for these displays.<br />
The value of 1.4 was used for developing countries<br />
in the 1983 IEA/ORAU study 2 and may be<br />
roughly characteristic of the historical situation<br />
in developing countries. However, as developing<br />
countries modernize in the decades ahead,<br />
113


