

ENERGY FOR A SUSTAINABLE WORLD - World Resources Institute
ENERGY FOR A SUSTAINABLE WORLD - World Resources Institute
ENERGY FOR A SUSTAINABLE WORLD - World Resources Institute

Create successful ePaper yourself
Turn your PDF publications into a flip-book with our unique Google optimized e-Paper software.
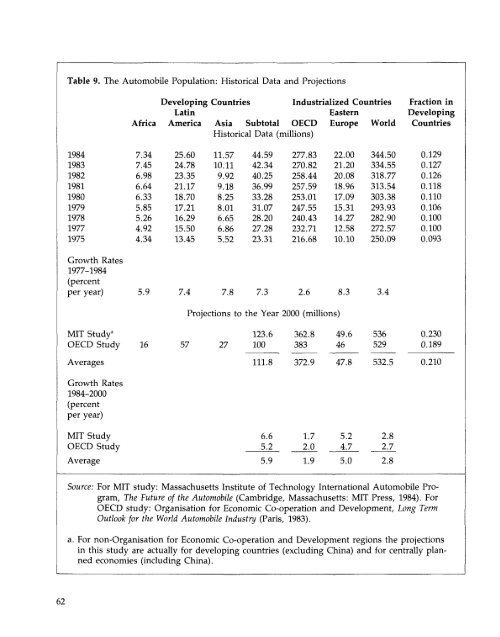
Table 9. The Automobile Population: Historical Data and Projections<br />
Developing Countries<br />
Latin<br />
Industrialized Countries<br />
Eastern<br />
Africa America Asia Subtotal OECD Europe <strong>World</strong><br />
Historical Data (millions)<br />
Fraction in<br />
Developing<br />
Countries<br />
1984<br />
1983<br />
1982<br />
1981<br />
1980<br />
1979<br />
1978<br />
1977<br />
1975<br />
7.34 25.60 11.57 44.59<br />
7.45 24.78 10.11 42.34<br />
6.98 23.35 9.92 40.25<br />
6.64 21.17 9.18 36.99<br />
6.33 18.70 8.25 33.28<br />
5.85 17.21 8.01 31.07<br />
5.26 16.29 6.65 28.20<br />
4.92 15.50 6.86 27.28<br />
4.34 13.45 5.52 23.31<br />
277.83<br />
270.82<br />
258.44<br />
257.59<br />
253.01<br />
247.55<br />
240.43<br />
232.71<br />
216.68<br />
22.00<br />
21.20<br />
20.08<br />
18.96<br />
17.09<br />
15.31<br />
14.27<br />
12.58<br />
10.10<br />
344.50<br />
334.55<br />
318.77<br />
313.54<br />
303.38<br />
293.93<br />
282.90<br />
272.57<br />
250.09<br />
0.129<br />
0.127<br />
0.126<br />
0.118<br />
0.110<br />
0.106<br />
0.100<br />
0.100<br />
0.093<br />
Growth Rates<br />
1977-1984<br />
(percent<br />
per year)<br />
5.9 7.4 7.8 7.3<br />
2.6<br />
8.3<br />
3.4<br />
Projections to the Year '. >000 (millions)<br />
MIT Study 3<br />
OECD Study<br />
123.6<br />
16 57 27 100<br />
362.8<br />
383<br />
49.6<br />
46<br />
536<br />
529<br />
0.230<br />
0.189<br />
Averages<br />
111.8<br />
372.9<br />
47.8<br />
532.5<br />
0.210<br />
Growth Rates<br />
1984-2000<br />
(percent<br />
per year)<br />
MIT Study<br />
OECD Study<br />
Average<br />
6.6<br />
5.2<br />
5.9<br />
1.7<br />
2.0<br />
1.9<br />
5.2<br />
4.7<br />
5.0<br />
2.8<br />
2.7<br />
2.8<br />
Source: For MIT study: Massachusetts <strong>Institute</strong> of Technology International Automobile Program,<br />
The Future of the Automobile (CambridgeMassachusetts: MIT Press, 1984). For<br />
OECD study: Organisation for Economic Co-operation and Development, Long Term<br />
Outlookfor the <strong>World</strong> Automobile Industry (Paris,1983).<br />
a. For non-Organisation for Economic Co-operation and Development regions the projections<br />
in this study are actually for developing countries excluding China) and for centrally planned<br />
economies (including China).<br />
62


