

ENERGY FOR A SUSTAINABLE WORLD - World Resources Institute
ENERGY FOR A SUSTAINABLE WORLD - World Resources Institute
ENERGY FOR A SUSTAINABLE WORLD - World Resources Institute

You also want an ePaper? Increase the reach of your titles
YUMPU automatically turns print PDFs into web optimized ePapers that Google loves.
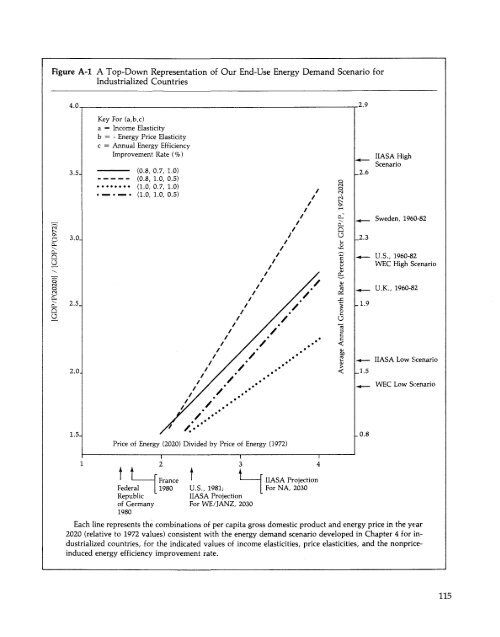
Figure A-l<br />
A Top-Down Representation of Our End-Use Energy<br />
Industrialized Countries<br />
Demand Scenario for<br />
4 0<br />
29<br />
3.5.<br />
Key For (a,b,c)<br />
a = Income Elasticity<br />
b = - Energy Price Elasticity<br />
c = Annual Energy Efficiency<br />
Improvement Rate (%)<br />
In n n T-I -i n\<br />
(0.8,1.0,0.5)<br />
(1.0, 1.0, 0.5)<br />
i<br />
8<br />
O<br />
< IIASA High<br />
Scenario<br />
.2.6<br />
/P(1972)<br />
O<br />
P(2020)]<br />
Q<br />
O<br />
3.0.<br />
2.5.<br />
/<br />
/<br />
/<br />
/<br />
/ O<br />
/ ^_<br />
D<br />
U<br />
u<br />
•£,<br />
// S<br />
• • 03<br />
%<br />
o<br />
O<br />
^ Sweden, 1960-82<br />
.2.3<br />
-+— U.S., 1960-82<br />
WEC High Scenario<br />
^ U.K., 1960-82<br />
.1.9<br />
/ / /<br />
/ / /<br />
inual<br />
2.0.<br />
/ / /<br />
era<br />
<<br />
-/\ i roj<br />
Federal 1980 U.S., 1981; For NA, 2030<br />
Republic<br />
IIASA Projection<br />
of Germany For WE/JANZ, 2030<br />
1980<br />
i<br />
Each ine represents the combinations of per capita gross domestic product and energy price in the year<br />
2020 (relative to 1972 values) consistent with the energy demand scenario developed in Chapter 4 for inprice<br />
elasticities, and the nonprice-<br />
dustrialized countries, for the indicated values of income elasticities,<br />
induced energy efficiency improvement rate.<br />
i<br />
4<br />
115


