

ENERGY FOR A SUSTAINABLE WORLD - World Resources Institute
ENERGY FOR A SUSTAINABLE WORLD - World Resources Institute
ENERGY FOR A SUSTAINABLE WORLD - World Resources Institute

Create successful ePaper yourself
Turn your PDF publications into a flip-book with our unique Google optimized e-Paper software.
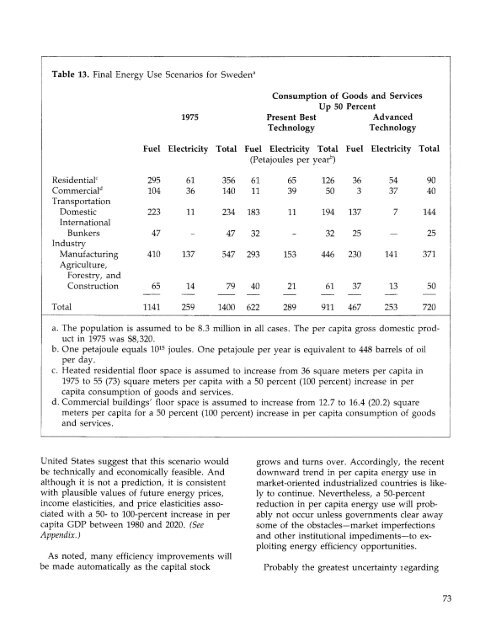
Table 13. Final Energy Use Scenarios for Sweden a<br />
1975<br />
Consumption of Goods and Services<br />
Up 50 Percent<br />
Present Best<br />
Advanced<br />
Technology<br />
Technology<br />
Fuel Electricity Total Fuel Electricity Total Fuel Electricity Total<br />
(Petajoules per year b )<br />
Residential 0<br />
Commercial" 1<br />
Transportation<br />
Domestic<br />
International<br />
Bunkers<br />
Industry<br />
Manufacturing<br />
Agriculture,<br />
Forestry, and<br />
Construction<br />
295<br />
104<br />
223<br />
47<br />
410<br />
65<br />
61<br />
36<br />
11<br />
137<br />
14<br />
356<br />
140<br />
61<br />
11<br />
234 183<br />
47 32<br />
547 293<br />
79 40<br />
65<br />
39<br />
11<br />
153<br />
21<br />
126<br />
50<br />
36<br />
3<br />
194 137<br />
32 25<br />
446 230<br />
61 37<br />
54<br />
37<br />
7<br />
141<br />
13<br />
90<br />
40<br />
144<br />
25<br />
371<br />
50<br />
Total<br />
1141<br />
259<br />
1400 622<br />
289<br />
911 467<br />
253<br />
720<br />
a. The population is assumed to be 8.3 million in all cases. The per capita gross domestic product<br />
in 1975 was $8,320.<br />
b. One petajoule equals 10 15 joules. One petajoule per year is equivalent to 448 barrels of oil<br />
per day.<br />
c. Heated residential floor space is assumed to increase from 36 square meters per capita in<br />
1975 to 55 (73) square meters per capita with a 50 percent (100 percent) increase in per<br />
capita consumption of goods and services.<br />
d. Commercial buildings' floor space is assumed to increase from 12.7 to 16.4 (20.2) square<br />
meters per capita for a 50 percent (100 percent) increase in per capita consumption of goods<br />
and services.<br />
United States suggest that this scenario would<br />
be technically and economically feasible. And<br />
although it is not a prediction, it is consistent<br />
with plausible values of future energy prices,<br />
income elasticities, and price elasticities associated<br />
with a 50- to 100-percent increase in per<br />
capita GDP between 1980 and 2020. (See<br />
Appendix.)<br />
As noted, many efficiency improvements will<br />
be made automatically as the capital stock<br />
grows and turns over. Accordingly, the recent<br />
downward trend in per capita energy use in<br />
market-oriented industrialized countries is likely<br />
to continue. Nevertheless, a 50-percent<br />
reduction in per capita energy use will probably<br />
not occur unless governments clear away<br />
some of the obstacles—market imperfections<br />
and other institutional impediments—to exploiting<br />
energy efficiency opportunities.<br />
Probably the greatest uncertainty legarding<br />
73


