

ENERGY FOR A SUSTAINABLE WORLD - World Resources Institute
ENERGY FOR A SUSTAINABLE WORLD - World Resources Institute
ENERGY FOR A SUSTAINABLE WORLD - World Resources Institute

You also want an ePaper? Increase the reach of your titles
YUMPU automatically turns print PDFs into web optimized ePapers that Google loves.
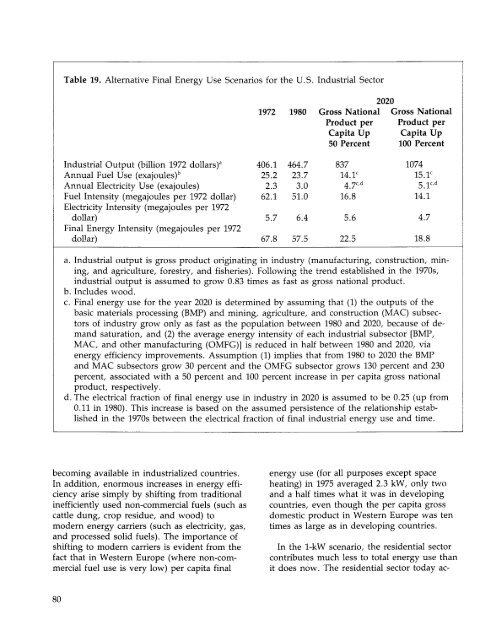
Table 19. Alternative Final Energy Use Scenarios for the U.S. Industrial Sector<br />
2020<br />
1972 1980 Gross National Gross National<br />
Product per Product per<br />
Capita Up Capita Up<br />
50 Percent 100 Percent<br />
Industrial Output (billion 1972 dollars) 3<br />
Annual Fuel Use (exajoules) b<br />
Annual Electricity Use (exajoules)<br />
Fuel Intensity (megajoules per 1972 dollar)<br />
Electricity Intensity (megajoules per 1972<br />
dollar)<br />
Final Energy Intensity (megajoules per 1972<br />
dollar)<br />
406.1<br />
25.2<br />
2.3<br />
62.1<br />
5.7<br />
67.8<br />
464.7<br />
23.7<br />
3.0<br />
51.0<br />
6.4<br />
57.5<br />
837<br />
14.1 C<br />
4.7 c - d<br />
16.8<br />
5.6<br />
22.5<br />
1074<br />
15. l c<br />
5.1 c ' d<br />
14.1<br />
4.7<br />
18.8<br />
a. Industrial output is gross product originating in industry (manufacturing, construction, mining,<br />
and agriculture, forestry, and fisheries). Following the trend established in the 1970s,<br />
industrial output is assumed to grow 0.83 times as fast as gross national product.<br />
b. Includes wood.<br />
c. Final energy use for the year 2020 is determined by assuming that (1) the outputs of the<br />
basic materials processing (BMP) and mining, agriculture, and construction (MAC) subsectors<br />
of industry grow only as fast as the population between 1980 and 2020, because of demand<br />
saturation, and (2) the average energy intensity of each industrial subsector [BMP,<br />
MAC, and other manufacturing (OMFG)] is reduced in half between 1980 and 2020, via<br />
energy efficiency improvements. Assumption (1) implies that from 1980 to 2020 the BMP<br />
and MAC subsectors grow 30 percent and the OMFG subsector grows 130 percent and 230<br />
percent, associated with a 50 percent and 100 percent increase in per capita gross national<br />
product, respectively.<br />
d. The electrical fraction of final energy use in industry in 2020 is assumed to be 0.25 (up from<br />
0.11 in 1980). This increase is based on the assumed persistence of the relationship established<br />
in the 1970s between the electrical fraction of final industrial energy use and time.<br />
becoming available in industrialized countries.<br />
In addition, enormous increases in energy efficiency<br />
arise simply by shifting from traditional<br />
inefficiently used non-commercial fuels (such as<br />
cattle dung, crop residue, and wood) to<br />
modern energy carriers (such as electricity, gas,<br />
and processed solid fuels). The importance of<br />
shifting to modern carriers is evident from the<br />
fact that in Western Europe (where non-commercial<br />
fuel use is very low) per capita final<br />
energy use (for all purposes except space<br />
heating) in 1975 averaged 2.3 kW, only two<br />
and a half times what it was in developing<br />
countries, even though the per capita gross<br />
domestic product in Western Europe was ten<br />
times as large as in developing countries.<br />
In the 1-kW scenario, the residential sector<br />
contributes much less to total energy use than<br />
it does now. The residential sector today ac-<br />
80


