WATER & SOIL - These are not the droids you are looking for.
WATER & SOIL - These are not the droids you are looking for.
WATER & SOIL - These are not the droids you are looking for.
Create successful ePaper yourself
Turn your PDF publications into a flip-book with our unique Google optimized e-Paper software.
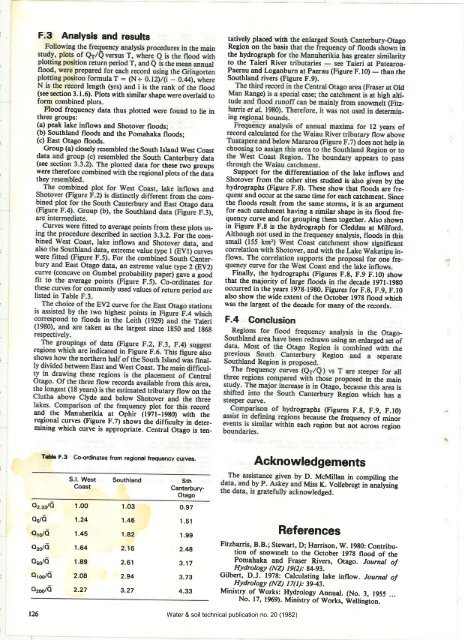
F.3 Analysis and results<br />
tatively placed with<br />
Region on <strong>the</strong> basis<br />
<strong>the</strong> hydrograph <strong>for</strong><br />
to <strong>the</strong> Taieri River<br />
Paerau and Loganburn at Paerau (Figure F. l0)<br />
Southland rivers (Figure F.9).<br />
-<br />
than <strong>the</strong><br />
(see section 3.1.6). Plots with similar shape were overlaid to<br />
<strong>for</strong>m combined plots.<br />
Flood frequency data thus plotted were found to lie in<br />
three groups:<br />
(a) peak lake inflows and Shotover floods;<br />
(b) Southland floods and <strong>the</strong> pomahaka floods;<br />
(c) East Otago floods.<br />
Group (a) closely resembled <strong>the</strong> South Island West Coast<br />
data<br />
Canterbury data<br />
(see<br />
<strong>the</strong>se two groups<br />
were<br />
I plots of <strong>the</strong> data<br />
<strong>the</strong>y<br />
Support <strong>for</strong> <strong>the</strong> differentiation of <strong>the</strong> lake inflows and<br />
Shotover from <strong>the</strong> o<strong>the</strong>r sites studied is also given by <strong>the</strong><br />
hydrographs (Figure F.8). <strong>These</strong> show that floods <strong>are</strong> frequent<br />
and occur at <strong>the</strong> same time <strong>for</strong> each catchment. Since<br />
<strong>the</strong> floods result from <strong>the</strong> same storms, it is an argument<br />
<strong>for</strong> each catchment having a similar shape in its flo;d frequency<br />
curve and <strong>for</strong> grouping <strong>the</strong>m toge<strong>the</strong>r. Also shown<br />
in Figure F.8 is <strong>the</strong> hydrograph <strong>for</strong> Cieddau at Mil<strong>for</strong>d.<br />
Finally,<br />
-<br />
<strong>the</strong> hydrographs (Figures F.8, F.9 F.lO) show<br />
that <strong>the</strong> majority of large floods in <strong>the</strong> decade l97l-19g0<br />
o-ccurred in <strong>the</strong> years 1978-1980. Figures <strong>for</strong> F.g, F.9, F.l0<br />
also show <strong>the</strong> wide extent of <strong>the</strong> October l97g flood which<br />
was <strong>the</strong> largest of <strong>the</strong> decade <strong>for</strong> many of <strong>the</strong> records.<br />
F.4 Gonclusion<br />
and <strong>the</strong> Manuherikia at Ophir (1971-1980) wirh rhe<br />
regional clrves (Figure F.7) shows <strong>the</strong> difficulty in determining<br />
which curve is appropriate. Central Otágo is ten_<br />
graphs (Figures F.8, F.9, F.l0)<br />
because <strong>the</strong> frequency of minor<br />
ach region but <strong>not</strong> across region<br />
ïable F.3 Co-ordinates fiom regional frequency curves.<br />
O2.33/O<br />
o5/o<br />
olo/o<br />
ozdo<br />
o5o/o<br />
orodo<br />
ozoo/o<br />
S.l. West<br />
Coast<br />
1.OO<br />
1.24<br />
1.45<br />
1.64<br />
1.89<br />
2.O8<br />
2.27<br />
Southland<br />
1.03<br />
1.46<br />
1.82<br />
2.16<br />
2.61<br />
2.94<br />
3.27<br />
sth<br />
Canterbury-<br />
Otago<br />
0.97<br />
1.51<br />
1.99<br />
2.48<br />
3.17<br />
3.73<br />
4.33<br />
Acknowledgements<br />
D. McMillan in compiling <strong>the</strong><br />
Miss K. Vollebregt in anatysing<br />
owledged.<br />
References<br />
Fitzharris, B.B.; Stewart, D; Harrison, W. l9g0: Contribution<br />
of snowmelt to <strong>the</strong> October l97g flood of <strong>the</strong><br />
Pomahaka and Fraser Rivers, Otago. Journal o!<br />
Hydrologlt (NZ) I9(2): 84-93.<br />
Gilbert, D.J. 1978: Calculating lake inflow. Journal o!<br />
Hydrologlt (NZ) I 7(I): 3943.<br />
Ministry of Works: Hydrology Annual. (No. 3, 1955 ...<br />
No. 17, 1969). Ministry of Works, Wellington.<br />
t2Á Water & soil technical publication no. 20 (1982)


