

WATER & SOIL - These are not the droids you are looking for.
WATER & SOIL - These are not the droids you are looking for.
WATER & SOIL - These are not the droids you are looking for.

Create successful ePaper yourself
Turn your PDF publications into a flip-book with our unique Google optimized e-Paper software.
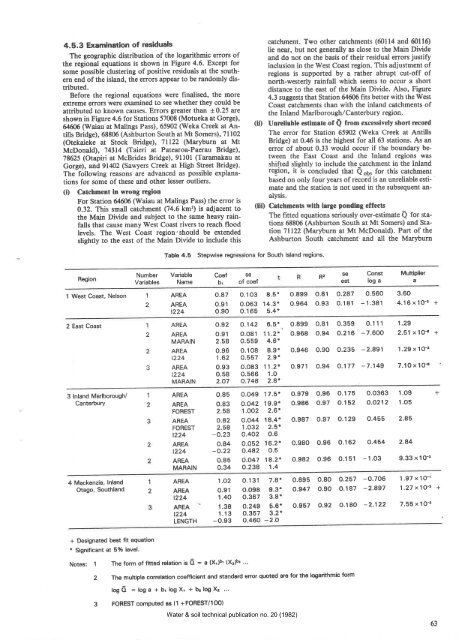
4.5.3 Examlnstion of residuals<br />
The geographic distribution of <strong>the</strong> logarithmic errors of<br />
<strong>the</strong> regional equations is shown in Figure 4.6. Except <strong>for</strong><br />
some possible clustering of positive residuals at <strong>the</strong> sou<strong>the</strong>rn<br />
end of <strong>the</strong> island, <strong>the</strong> errors appear to be randomly distributed.<br />
Be<strong>for</strong>e <strong>the</strong> regional equations were finalised, <strong>the</strong> more<br />
extreme errors were examined to see whe<strong>the</strong>r <strong>the</strong>y could be<br />
attributed to known causes. Errors greater than t0.25 a¡e<br />
shown in Figure 4.6 <strong>for</strong> Stations 57008 (Motueka at Gorge),<br />
64ó06 (Waiau at Malings Pass), 65902 (Weka Creek at Antills<br />
Bridge), 68806 (Ashburton South at Mt Somers'),7ll02<br />
(Otekaieke at Stock Bridge), 71122 (Maryburn at Mt<br />
McDonald), 74314 (Taieri at Patearoa-Faerau Bridge),<br />
78625 (Otapiri at McBrides Bridge), 9ll0l (Taramakau at<br />
Gorge), atd9l4O2 (Sawyers Creek at High Street Bridge).<br />
The following reasons <strong>are</strong> advanced as possible explanations<br />
<strong>for</strong> some of <strong>the</strong>se and o<strong>the</strong>r lesser outliers.<br />
(Ð Cstchment in wrong region<br />
For Station 64ó06 (V/aiau at Malings Pass) <strong>the</strong> error is<br />
0.32. This small catchment (74.6 km') is adjacent to<br />
<strong>the</strong> Main Divide and subject to <strong>the</strong> same heavy rainfalls<br />
that cause many rWest Coast rivers to reach flood<br />
levels. The West Coast region'should be extended<br />
slightly to <strong>the</strong> east of <strong>the</strong> Main Divide to include this<br />
catchment. Two o<strong>the</strong>r catchments (60114 and 60116)<br />
lie near, but <strong>not</strong> generally as close to <strong>the</strong> Main Divide<br />
and do <strong>not</strong> on <strong>the</strong> basis of <strong>the</strong>ir residual errors justify<br />
inclusion in <strong>the</strong> West Coast region. This adjustment of<br />
regions is supported by a ra<strong>the</strong>r abrupt cut-off of<br />
north-westerly rainfall which seems to occur a short<br />
distance to <strong>the</strong> east of <strong>the</strong> Main Divide. Also, Figure<br />
4.3 suggests that Station 64606 fits better with <strong>the</strong> West<br />
Coast catchments than with <strong>the</strong> inland catchments of<br />
<strong>the</strong> Inland Marlborough/Canterbury region.<br />
(it) Unreli¡ble e¡tlm¡te of Q from excessively short record<br />
The error <strong>for</strong> Station 65902 (Weka Creek at Antills<br />
Bridee) at 0,6 is <strong>the</strong> higlrest <strong>for</strong> all 63 stations. As an<br />
error of about 0.33 would occur if <strong>the</strong> bounda¡y between<br />
<strong>the</strong> East Coast and <strong>the</strong> Inland regions was<br />
shifted slichtlv to include <strong>the</strong> catchment in <strong>the</strong> Inland<br />
region, it-is óoncluded that Qo6, <strong>for</strong> this catchs€nt<br />
ba--sed on only fóùr'years of recdiã is an unreiiable estìmate<br />
and <strong>the</strong> station is <strong>not</strong> used in <strong>the</strong> subsequent analysis.<br />
(lil) Catchments wlth large pondlng effects<br />
The frrtted equations seriously ov€r-estimate Q <strong>for</strong> stations<br />
68806 (Ashburton South at Mt Somers) and Station<br />
71122 (Maryburn at Mt McDonald). Part of <strong>the</strong><br />
Ashburton South catchment and all <strong>the</strong> Maryburn<br />
Region<br />
1 West Coast, Nelson 1<br />
Number Variable<br />
Variables Name<br />
2<br />
faHe 4.5 Stepwise regressions <strong>for</strong> South lsland regions.<br />
AREA<br />
AREA<br />
1224<br />
Coef<br />
br<br />
se<br />
of coef<br />
0.87 0.103 8.5*<br />
o.91 0.063 14.3*<br />
o.90 0.165 5.4*<br />
2 East Coast 1 AREA 0.92 0j42 6.5*<br />
2 AREA o.91 0.081 11.2*<br />
MARAIN 2.58 0.559 4.6'<br />
AREA 0.96 0.108 8.9t<br />
1224 1.62 0.557 2.9*<br />
AREA 0.93 0.083 1 1.2*<br />
1224 o.58 0.566 1.O<br />
MARAIN 2.O7 0.14A 2.8*<br />
3 lnland Marlborough/<br />
Canterbury<br />
4 Mackenzie, lnland<br />
Otago, Southland<br />
+ Designated beet fit equation<br />
* Significant at 5% level.<br />
Notes: 1<br />
1<br />
2<br />
AREA<br />
AREA<br />
FOREST<br />
AREA<br />
FOREST<br />
1224<br />
AREA<br />
1224<br />
AREA<br />
MARAIN<br />
o.85 0.049 17.5*<br />
0.83 0.042 19.9'<br />
2.58 1.OO2 2.6'.<br />
o.82 0.044 18.4*<br />
2.58 1.032 2.5'.<br />
-o.23 0.402 0.6<br />
o.84 0.052 16.2*<br />
-o.22 0.4A2 0.5<br />
o.85<br />
0.34<br />
o.o47 18.z',<br />
0.238 1,4<br />
o.899<br />
0.964<br />
R2<br />
se<br />
est<br />
Const Muhiplier<br />
loga<br />
a<br />
o.81 0.2A7 0.560 3.60<br />
O.93 0.181 -'l .381 4.16x1O-'z+<br />
0.899 0.81 0.359 0.1 1 1 '.|.29<br />
0.968 O.94 0.216 -7.600 2.51 x 10{ +<br />
0.946 O.9O 0.235 -2'891<br />
1 .29 x 1O-3<br />
0.971 0.94 0.177 -7.149 7'1O x 1O{<br />
0.979 0.96 0.175 0.0363 1.O9<br />
0.986 0.97 0.152 0.O212 1.O5<br />
0.987 0.97 0.129 0.455 2.45<br />
0.980 0.96 0.162 0.454 2'84<br />
0.982 0.96 O,1 51 - 1 .O3 9'33 x 1O-2<br />
AREA 1.O2 0.131 7.8' o.89s 0.80 0.257 -0.706 1.97 x 1O{<br />
1<br />
2 AREA o.91 0.098 9.3* 0.947 O.9O O.1A7 -2.A97 1.27 x1O4 +<br />
1224 1.40 0.367 3.8*<br />
AREA 1.38 0.249 5.6* 0.957 0.92 O.180 -2'122 7.55x1O-3<br />
t224 1.13 0,357 3.2'<br />
LENGTH -o.93 0.460 -2.O<br />
The <strong>for</strong>m of fitted relation is O = a ¡¡'¡b' (Xzlb' "'<br />
2 The multiple cor¡elation coefficient and standa¡d error quoted <strong>are</strong> fo¡ <strong>the</strong> lcgarithmic <strong>for</strong>m<br />
log O = log a + br log Xr + br log Xz '..<br />
3 FOREST computed as (1 +FOREST/IOOl<br />
Water & soil technical publication no. 20 (1982)<br />
63


