Using <strong>the</strong> regional equation Qest 1940 m'ls, as in Example I Combining <strong>the</strong>se estimates from <strong>the</strong> record and regional equation, using a weighting factor of 0.5 <strong>for</strong> both (see section 5.2.2), gives a = 0.5x1435+0.5x194O 1688 m',/s (b) As N< 10, <strong>the</strong> regional curve should still be applied to estimate Q,oo. The curve ordinate is unchanged at Q,oolQ : 2.89 (c) Combining <strong>the</strong> estimates of Q and Q,oolQ results in Q,oo 1688 x 2.89 = 4878 m!/s (d) In obtaining <strong>the</strong> standard error of estimate, <strong>the</strong> RHS terms in Equation 3.25 changed from Example I <strong>are</strong> E(Q) = 1688 m3,/s and <strong>the</strong> variance of Q estimated from <strong>the</strong> flood record is given by E(Q) and var(Q) 1704 m'ls (cu.Q)' N = (0.54 x 1704)' = 6.048 x 10. t4 There<strong>for</strong>e, from Equation 3.25 var(Qroo) l1M' x 0.522 + 2.89' x 6.048 x l0' = 2.021 x 10⁶ Thus Se(Q'oo) : (2.021 x10⁶)v, 1422 m3/s which is 2590 of Q,oo 5.4.4 Example 4: N:21 (a) As in Example 3, Q can be estimated directly from <strong>the</strong> annual series. var(Qo6) - (Cn'Qou')' 2t N i]r where C" : The Cn <strong>for</strong> <strong>the</strong> 0.54 from 2l years of record is 0.43, which comp<strong>are</strong>s Figure 4.12 well with <strong>the</strong> regional estimate of C" : 9.54 Thus var(Qo6) : (0.54 x (b) Since T ) 5N and N > 20, frequency analyses may be 1435)' : 2.002 x l0' per<strong>for</strong>med on <strong>the</strong> annual series using two- and three-parameter distributions. The EVI distribution fitted by <strong>the</strong> 3 The variance maximum of likelihood method gives Q estimated from a good fit to <strong>the</strong> data <strong>the</strong> regional equation is <strong>the</strong> and yields same as in Example l, i.e., var(QesJ = 3.410x10⁵ Q'oo : 4l7O m'/s and an approximate standard error of estimate of 800 m',/s. From Equation 4.10, <strong>the</strong> variance of <strong>the</strong> combined estimate (This of Q is standard error is based on a <strong>for</strong>mula used by NERC (1975, p. 170), assuming Cu : 0.54). l:l+l (c) The corresponding estimate using <strong>the</strong> regional curve is var(Q) var(Qo') var(Q.r¡) 2.002 x l0r Q,oo 1665x2.89:4812m3/s and <strong>the</strong> associated standard error of estimate is obtained + from Equation 3.25 as 3.410 x l0r var(Q,oo) 1665' x 0.522 + 2.8g'z x (0'54 x 1665)'z so that var(Q) = 1.261 x 10⁵ 2l Hence from Equation 1.769 x loó 3.25 so that var(Qroo) 1688' 0.522 + 2.89'? x 1.261 x 10⁵ : 2.541 x Se(Q'oo) 1330 m3,/s which is 2490 of 106 Q,oo and Se(Q,oo) = (2.541 x l0ó)/z 1594 m!/s, which is 2890 of Q,oo 5.4.5 Results Summary Table 5.2 summarises <strong>the</strong> estimates of Q and Q'oo obtained in <strong>the</strong> four examples using <strong>the</strong> RFE method. 5.4.3 Example 3: N: 14 The reduction in <strong>the</strong> standard error of estimate in Table (a) As N > N"( = 3), Q can be estimated directly from <strong>the</strong> 5.2 with increase in record length illustrates <strong>the</strong> value of increasing lengths of flood record. In Example 4, a second annual series. Hence estimate of Q,oo : 4l7O m'ls (by frequency analysis of <strong>the</strong> l4 2l years ofrecord) is available and a designer would choose a = I a weighted mean of <strong>the</strong> two. I ei =1704m',/s It will be seen that <strong>the</strong> estimate of Q in <strong>the</strong> second example, obtained by combining <strong>the</strong> estimates from <strong>the</strong> re- 14 i-: I gional equation and <strong>the</strong> three years of record, is closer to (b) Applying <strong>the</strong> regional curve produces <strong>the</strong> Q estimate using <strong>the</strong> full flood record than that in Example 3 which is based on 14 years and, as a consequence, Q'oo :1704 x2.89 = 4925 m3/s <strong>the</strong> corresponding Q,oo estimate is also closer to <strong>the</strong> Qroo estimate determined from <strong>the</strong> full record. Although this may be a chance result it does emphasise that even a short (c) The new RHS terms in Equation 3.25 <strong>are</strong> flood record is useful. Water & soil technical publication no. 20 (1982) 81 a 2t = I )- Qi:1665m'/s
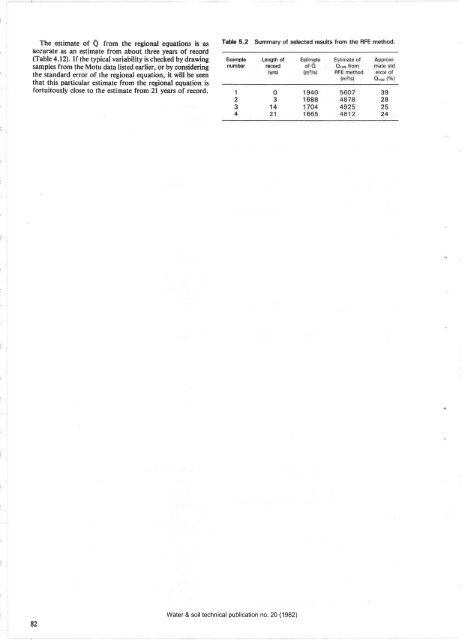
The estimate of Q from <strong>the</strong> regional equations is as accurate as an estimate from about three y€ars of record (Table 4. l2). If <strong>the</strong> typical variability is checked by drawing samples from <strong>the</strong> Motu data listed earlier, or by considering <strong>the</strong> standard error of <strong>the</strong> regional equation, it will be seen that this particular estimate from <strong>the</strong> regional equation is <strong>for</strong>tuitously close to <strong>the</strong> estimate from 2l years of record. Table 5.2 Summary of selected results from <strong>the</strong> RFE method. Example number 1 2 3 4 Length of recor.d (yrsl o 3 14 21 Estimate ofO (m3/s) 39 28 25 24 82 Water & soil technical publication no. 20 (1982)
- Page 1 and 2:
WATER & SOIL TECHNICAL PUBLICATION
- Page 3 and 4:
Regional flood est¡mat¡on in New
- Page 5 and 6:
Tables 1.1 Risk ofexceedence for sp
- Page 7 and 8:
Preface Water & soil technical publ
- Page 9 and 10:
annual flood Q (the mean of the ann
- Page 11 and 12:
Water & soil technical publication
- Page 13 and 14:
Doto ovoiloble on TIDEDA Figure 2'1
- Page 15 and 16:
P=45 O= 15 x4 (l) '= o o t.25 2'.O
- Page 17 and 18:
Êv2 ( ko) Reduced Voriote y I'O t1
- Page 19 and 20:
turn period. A plotting position fo
- Page 21 and 22:
'o ,l\, I zl l- I Water & soil tech
- Page 23 and 24:
Table 3.2 Flow stat¡ons used. SITE
- Page 25 and 26:
e process of examining the simtrend
- Page 27 and 28:
Iì_ t_ I I I I I I I t-. I I tñ I
- Page 29 and 30:
Þ I"IEST COFST 0 o I E 6o o o 25 3
- Page 31 and 32: SOUTHEBN REDUCEO Y VRBIßTE NETURN
- Page 33 and 34: SOUTH ISLFND HEST COFST I]ÊTR èo
- Page 35 and 36: SOUTH CÊNTERBURY DRTÊ NEOUCEO Y V
- Page 37 and 38: COMB I NED ,,IE5T CORST DRTR o rt
- Page 39 and 40: BÊY OF PLENTY DRTF o o o NEOUCEO Y
- Page 41 and 42: NOBTH ISLRND ßEGIONÊL CUBVES 1.50
- Page 43 and 44: data for this area are required bef
- Page 45 and 46: NELSON REGIONFL CURVE BEOUCEO Y VRR
- Page 47 and 48: 46 EÊSTEFìN NEI,,I ZEFLÊND DÊTI
- Page 49 and 50: Table 3.9 The grouping and the grou
- Page 51 and 52: allowing curves rather than just st
- Page 53 and 54: 3.5.5 Extension method The NERC (19
- Page 55 and 56: Table 4.1 South lsland catchment ch
- Page 57 and 58: I 2 t l¡ 5 5 7 I 9 l0 t1 ,12 I5 1{
- Page 59 and 60: decided instead to use estimates of
- Page 61 and 62: \Í l{ I t, ìj( Fþurc 4.4 Distrib
- Page 63 and 64: 62 Fþurc 4,6 Logarithmic rcsidual
- Page 65 and 66: Table 4.6 Final equations for South
- Page 67 and 68: I ++ ++ * E 4.6 Analysis of North l
- Page 69 and 70: Non Pumice = õ = 3-24xto'6 AREA'7
- Page 71 and 72: Northlond f C"ro^ondel f Eost Cope
- Page 73 and 74: Table 4.11 Comparable equations for
- Page 75 and 76: Poo led cv Pooled o.40 F¡guro 4.12
- Page 77 and 78: mates of Cp typically range between
- Page 79 and 80: -J æ 'll o Eo !¡ Assemble llood p
- Page 81: Year 1958 1959 1960 l96r t962 1963
- Page 85 and 86: Water & soil technical publication
- Page 87 and 88: Maguiness, J.A.; Blackwood, P.L.; B
- Page 89 and 90: The liequency factor K is a functio
- Page 91 and 92: e.9., Linsley et ol. (1915); lrish
- Page 93 and 94: Maguiness, J.A.; Blackwood, P.L.; B
- Page 95 and 96: sltt 930 t [rûltRÀict ¡ l? s;¡t
- Page 97 and 98: 3950't flrlÀRt R tr îlt¡Ît ;tP
- Page 99 and 100: S ITI 29202 RuNttiltcl I ¡t tllEtt
- Page 101 and 102: ïI-'_____ ::19: lt¡IPt0r n À1 i
- Page 103 and 104: 9100r GNE? R ¡T DOBSO| s¡18 93207
- Page 105 and 106: 6800 1 sBlrri R tT SrITEC¡,tttS 6I
- Page 107 and 108: APPENDIX C Summary of tho data for
- Page 109 and 110: oæ ON LAT. STATION NA ATION LAT. N
- Page 111 and 112: o NUI,IBER HHAKAIIARU 854801 38 L7'
- Page 113 and 114: l9 AT NU¡IB ËR AR',tËtlANA ÂRAI
- Page 115 and 116: A ON LAT. STATION NA NUMBER AHUNA 5
- Page 117 and 118: â NUI,IBER Lü{G.E ON NU14EER I,IU
- Page 119 and 120: æ TATI ¡rouNT sor.tERS 7L740? 43
- Page 121 and 122: N) o STATIoN NAr{gmLfï3---ffij NUI
- Page 123 and 124: APPENDIX E Compadson of Regional Fl
- Page 125 and 126: Table F.2 Flood peak data. NEW OTAG
- Page 127 and 128: F.3 Analysis and results tatively p
- Page 129 and 130: ét êt REOUCEO VßFIHTE 2. 33 5 l0
- Page 131 and 132: SOLITH I EA l') COAST soUTH CANTERB
- Page 133 and 134:
0tiftflt a itÉitut5 ü¡. il/5 tg?
- Page 135:
Water & soil technical publication