correlations between (logs oÐ FOREST and 1224, and FOREST and MARAIN were 0.90 and 0.65 respectively; this was one region where estimates of l2?A were suspected to be unreliable. The preferred equations of Table 4.10 <strong>are</strong> shown in Figure 4.10 with <strong>the</strong>ir appropriate regions, and also <strong>the</strong> residual errors <strong>for</strong> logarithms. In general <strong>the</strong> equations seem more reliable in <strong>the</strong> north and east of <strong>the</strong> island, a situation also <strong>not</strong>ed in <strong>the</strong> South Island. The distribution ofresiduals generally appears reasonably random in space. The region <strong>for</strong> <strong>the</strong> West Coast includes a number of catchments tributary to <strong>the</strong> Wanganui River and a number originating on <strong>the</strong> slopes of <strong>the</strong> central North Island volcanoes. Many of <strong>the</strong> larger residuals <strong>for</strong> <strong>the</strong> island <strong>are</strong> clustered here, presumably because of <strong>the</strong> variety of soil types, including pumice, and <strong>the</strong> sparse coverage of rainfall intensity measurements. The equations <strong>for</strong> <strong>the</strong> East Coast and West Coast regions suggest that <strong>the</strong>y should be combined into one, but doing so resulted in regional biases. Hence <strong>the</strong> separate regions should be maintained. 4.7 Discussion of results The equations derived in sections 4.5 and 4.6 <strong>are</strong> intended <strong>for</strong> application to rural catchments where flood storage is <strong>not</strong> excessive or where o<strong>the</strong>r dampening effects <strong>are</strong> <strong>not</strong> dominant. All <strong>the</strong> nine regional equations use catchment <strong>are</strong>a, and all but one use <strong>are</strong>a and one or two of <strong>the</strong> rainfall statistics; o<strong>the</strong>r physical catchment characteristics used in this study appear to be of little consequence. This is an important finding, since results obtained in overseas countries (see section 4.8) have suggested that <strong>the</strong>se o<strong>the</strong>r physical characteristics <strong>are</strong> relatively important. The dominance of rainfall statistics is possibly due to <strong>the</strong> generally steep nature of New Zealand catchments (see section 4.8). The two sets of rainfall statistics considered in <strong>the</strong> study have a large range of values; both cover more than one order of magnitude in <strong>the</strong> South Island, though <strong>the</strong> range is less in <strong>the</strong> North Island. Since this study was completed, an updated analysis of rainfall intensity data has become available (Tomlinson 1980; Coulter and Hessell 1980). Tomlinson used 16000 years of data from 940 manual daily raingauges and 3500 years from 180 recording raingauges. Comparison of revised 1224 estimates with those from Robertson (1963) <strong>for</strong> a sample of 87 stations did <strong>not</strong> reveal statistically significant differences. This suggested that <strong>the</strong> revised estimates may also be used <strong>for</strong> estimating 1224. Sirce <strong>the</strong> revision used more than twice <strong>the</strong> number of stations, more accurate estimates of 1224 lor individual catchments should be possible. For convenience, revised 1224 estimates <strong>for</strong> <strong>the</strong> 94O daily gauges used by Tomlinson <strong>are</strong> included as Appendix D. - The revised intensity data were also mapped by Tomlinson. However, in high altitude <strong>are</strong>as, especially along <strong>the</strong> Sou<strong>the</strong>rn Alps, use of <strong>the</strong> mapped values is <strong>not</strong> recommended. In mapping, rainfall is assumed to increase with altitude, This increase was <strong>not</strong> allowed <strong>for</strong> when catchment estimates <strong>for</strong> l2A were made, so <strong>the</strong> maps will give catchment estimates of 1224 greater than <strong>the</strong> estimates used in deriving <strong>the</strong> equations <strong>for</strong> Q. Thus inflated Q estimates may result from The 2-year rec uration intensitY estimated from auges was used principally because of <strong>the</strong> better national coverage of daily iead manual gauges <strong>for</strong> observing this duration rainfall comp<strong>are</strong>d with shorter duration rainfall statistics estimated from automatic rainfall recorder data. As <strong>not</strong>ed in section 4.4, estimates of catchment mean annual rainfall have a low accuracy <strong>for</strong> many South Island and this is possibly why inclusion of mean annual rainfall improves <strong>the</strong> estimate in three of <strong>the</strong> five North Island regional equations. Little can be saicl of <strong>the</strong> physical significance of <strong>the</strong> exponents <strong>for</strong> <strong>the</strong> regional equations. Whilst values of <strong>the</strong> intensity exponent around unity <strong>for</strong> two of <strong>the</strong> South Island regions might have some physical interpretation, <strong>the</strong> meaning of exponents of <strong>the</strong> rainfall statistics which exceed 2.0 is unclear, even though <strong>the</strong>ir statistical significance is undoubted. Obviousl),, in using <strong>the</strong> equations, particular c<strong>are</strong> must be given to <strong>the</strong> estimation of rainfall statistics, because estimates outside of <strong>the</strong> range of <strong>the</strong> values of <strong>the</strong> sample used in developing <strong>the</strong> equations could result in severe errors in estimates of Q. Tables 4.1 and 4.2 <strong>are</strong> a guide to typical valtues of <strong>the</strong> rainfall statistics. Where a catchment lies near a regional boundary and each regional equation gives different estimates, <strong>the</strong> precise location of<strong>the</strong> boundary is bound to create difficulties. For some regions, dominant flood-producing wea<strong>the</strong>r patterns <strong>are</strong> thought to apply, and a decision about which region a catchment fits into could be based on <strong>the</strong> wea<strong>the</strong>r conditions which <strong>are</strong> believed to produce <strong>the</strong> most flooding. An example is a number of Marlborough and Canterbury rivers in <strong>the</strong> Inland region, where <strong>the</strong> flood-producing wea<strong>the</strong>r conditions <strong>are</strong> possibly sou<strong>the</strong>rly. Their headwaters near <strong>the</strong> divide flood in nor'westerly wea<strong>the</strong>r condi tions and fit in <strong>the</strong> West Coast region. The rivers flow through <strong>the</strong> East Coast region where flood-producing wea<strong>the</strong>r patterns <strong>are</strong> thought to be easterly. In <strong>the</strong> case of <strong>the</strong> North Island Pumice region, catchments have been included where pumice was thought to have a dominant influence on <strong>the</strong> flood hydrology, but two coastal Bay of Plenty catchments were tentatively included here because this was where <strong>the</strong>y fitted best, even although pumice is <strong>not</strong> dominant on <strong>the</strong>se small catchments. rÙVithin <strong>the</strong> Pumice region, <strong>the</strong>re appears to be a gradation in <strong>the</strong> effect of <strong>the</strong> pumice. For instance, pumice lies to great depths on <strong>the</strong> Kaingaroa Plateau within which much of <strong>the</strong> catchment of <strong>the</strong> Rangitaiki River lies. The 28 years of record <strong>for</strong> this river at Murupara (AREA : ll84km', Station 15408), but which was <strong>not</strong> used because it exceeds ll00 km', gives_a Qous : 41.6 m'/s but <strong>the</strong> estimate from <strong>the</strong> equation is Q"rt = 202 m3/s, representing a residual error of - 0.69. Clearly, <strong>the</strong> dampening effects of pumice <strong>are</strong> severe in this case. The annual flood regions delineated in this chapter <strong>are</strong>' in general, very similar to <strong>the</strong> flood frequency regions defined in Chapter 3. An exception to this is in <strong>the</strong> eastern <strong>are</strong>a of <strong>the</strong> South Island (see Figure 4.7). From a design characteristics, on <strong>the</strong> o<strong>the</strong>r hand, is also concerned with <strong>the</strong> coefficients of variation and skewness of <strong>the</strong> flood record, and <strong>the</strong>se can be regarded as <strong>the</strong> slopes and curvatures respectively of <strong>the</strong> individual dimensionless-magni- There<strong>for</strong>e it was <strong>not</strong> unexof <strong>the</strong> flood frequencY chargions that differed in Places from <strong>the</strong> set deveioped <strong>for</strong> estimating Q. 4.8 Compar¡son with o<strong>the</strong>r results Similar equations given in Table 4.ll l. favourably in terms ent of determination this needs to be balanced against <strong>the</strong> use of a relatively small range of catchment <strong>are</strong>as (0'2 to ll00 km'); poorer fits may be obtained if larger catchments <strong>are</strong> used' The o<strong>the</strong>r <strong>not</strong>able feature of Table 4'll is <strong>the</strong> range of expon- estimated with reasonable accuracy <strong>for</strong> <strong>the</strong> North Island, ents <strong>for</strong> AREA. The values tend to be less than <strong>the</strong> values Water & soil technical publication no. 20 (1982) 7l
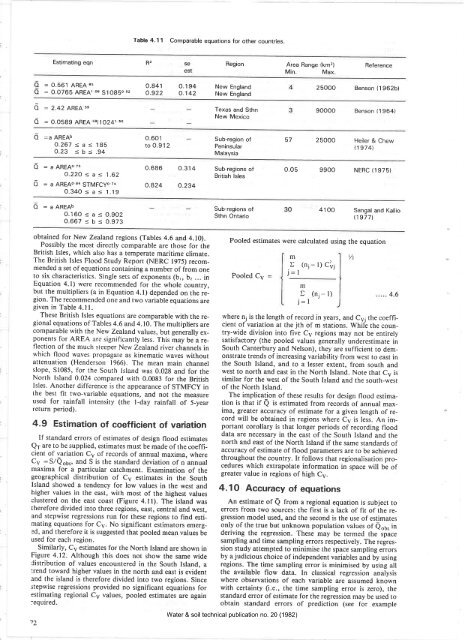
Table 4.11 Comparable equations <strong>for</strong> o<strong>the</strong>r countries, Est¡mat¡ng eqn R2 SC est Region Area Range (km,) Min. Max. Reference o o = 0.56 1 AREA 8s : 0.0765 AREAi o€ S1O85o s' o.841 o.922 o.1 94 o.142 New England New England : 2.42 AREA ss Texas and Sthn = o.o589 AREA 68110241 New Mexico 50 250OO Benson ('l 962b) 90000 Benson (1 964) O :a AREAb 0.267
- Page 1 and 2:
WATER & SOIL TECHNICAL PUBLICATION
- Page 3 and 4:
Regional flood est¡mat¡on in New
- Page 5 and 6:
Tables 1.1 Risk ofexceedence for sp
- Page 7 and 8:
Preface Water & soil technical publ
- Page 9 and 10:
annual flood Q (the mean of the ann
- Page 11 and 12:
Water & soil technical publication
- Page 13 and 14:
Doto ovoiloble on TIDEDA Figure 2'1
- Page 15 and 16:
P=45 O= 15 x4 (l) '= o o t.25 2'.O
- Page 17 and 18:
Êv2 ( ko) Reduced Voriote y I'O t1
- Page 19 and 20:
turn period. A plotting position fo
- Page 21 and 22: 'o ,l\, I zl l- I Water & soil tech
- Page 23 and 24: Table 3.2 Flow stat¡ons used. SITE
- Page 25 and 26: e process of examining the simtrend
- Page 27 and 28: Iì_ t_ I I I I I I I t-. I I tñ I
- Page 29 and 30: Þ I"IEST COFST 0 o I E 6o o o 25 3
- Page 31 and 32: SOUTHEBN REDUCEO Y VRBIßTE NETURN
- Page 33 and 34: SOUTH ISLFND HEST COFST I]ÊTR èo
- Page 35 and 36: SOUTH CÊNTERBURY DRTÊ NEOUCEO Y V
- Page 37 and 38: COMB I NED ,,IE5T CORST DRTR o rt
- Page 39 and 40: BÊY OF PLENTY DRTF o o o NEOUCEO Y
- Page 41 and 42: NOBTH ISLRND ßEGIONÊL CUBVES 1.50
- Page 43 and 44: data for this area are required bef
- Page 45 and 46: NELSON REGIONFL CURVE BEOUCEO Y VRR
- Page 47 and 48: 46 EÊSTEFìN NEI,,I ZEFLÊND DÊTI
- Page 49 and 50: Table 3.9 The grouping and the grou
- Page 51 and 52: allowing curves rather than just st
- Page 53 and 54: 3.5.5 Extension method The NERC (19
- Page 55 and 56: Table 4.1 South lsland catchment ch
- Page 57 and 58: I 2 t l¡ 5 5 7 I 9 l0 t1 ,12 I5 1{
- Page 59 and 60: decided instead to use estimates of
- Page 61 and 62: \Í l{ I t, ìj( Fþurc 4.4 Distrib
- Page 63 and 64: 62 Fþurc 4,6 Logarithmic rcsidual
- Page 65 and 66: Table 4.6 Final equations for South
- Page 67 and 68: I ++ ++ * E 4.6 Analysis of North l
- Page 69 and 70: Non Pumice = õ = 3-24xto'6 AREA'7
- Page 71: Northlond f C"ro^ondel f Eost Cope
- Page 75 and 76: Poo led cv Pooled o.40 F¡guro 4.12
- Page 77 and 78: mates of Cp typically range between
- Page 79 and 80: -J æ 'll o Eo !¡ Assemble llood p
- Page 81 and 82: Year 1958 1959 1960 l96r t962 1963
- Page 83 and 84: The estimate of Q from the regional
- Page 85 and 86: Water & soil technical publication
- Page 87 and 88: Maguiness, J.A.; Blackwood, P.L.; B
- Page 89 and 90: The liequency factor K is a functio
- Page 91 and 92: e.9., Linsley et ol. (1915); lrish
- Page 93 and 94: Maguiness, J.A.; Blackwood, P.L.; B
- Page 95 and 96: sltt 930 t [rûltRÀict ¡ l? s;¡t
- Page 97 and 98: 3950't flrlÀRt R tr îlt¡Ît ;tP
- Page 99 and 100: S ITI 29202 RuNttiltcl I ¡t tllEtt
- Page 101 and 102: ïI-'_____ ::19: lt¡IPt0r n À1 i
- Page 103 and 104: 9100r GNE? R ¡T DOBSO| s¡18 93207
- Page 105 and 106: 6800 1 sBlrri R tT SrITEC¡,tttS 6I
- Page 107 and 108: APPENDIX C Summary of tho data for
- Page 109 and 110: oæ ON LAT. STATION NA ATION LAT. N
- Page 111 and 112: o NUI,IBER HHAKAIIARU 854801 38 L7'
- Page 113 and 114: l9 AT NU¡IB ËR AR',tËtlANA ÂRAI
- Page 115 and 116: A ON LAT. STATION NA NUMBER AHUNA 5
- Page 117 and 118: â NUI,IBER Lü{G.E ON NU14EER I,IU
- Page 119 and 120: æ TATI ¡rouNT sor.tERS 7L740? 43
- Page 121 and 122: N) o STATIoN NAr{gmLfï3---ffij NUI
- Page 123 and 124:
APPENDIX E Compadson of Regional Fl
- Page 125 and 126:
Table F.2 Flood peak data. NEW OTAG
- Page 127 and 128:
F.3 Analysis and results tatively p
- Page 129 and 130:
ét êt REOUCEO VßFIHTE 2. 33 5 l0
- Page 131 and 132:
SOLITH I EA l') COAST soUTH CANTERB
- Page 133 and 134:
0tiftflt a itÉitut5 ü¡. il/5 tg?
- Page 135:
Water & soil technical publication