WATER & SOIL - These are not the droids you are looking for.
WATER & SOIL - These are not the droids you are looking for.
WATER & SOIL - These are not the droids you are looking for.
You also want an ePaper? Increase the reach of your titles
YUMPU automatically turns print PDFs into web optimized ePapers that Google loves.
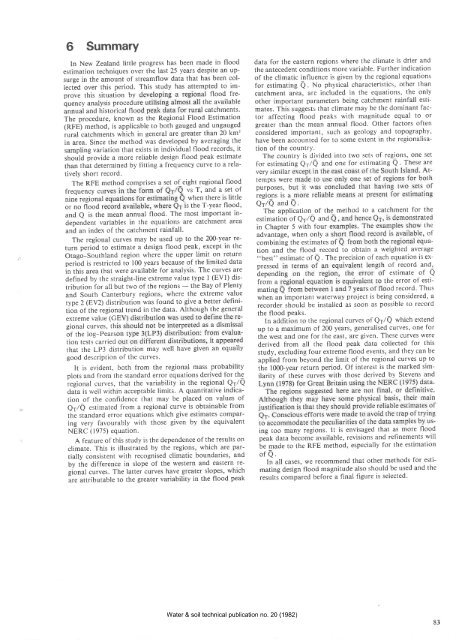
6 Summary<br />
In New Zealand little progress has been made in flood<br />
estimation techniques over <strong>the</strong> last 25 years despite an upsurge<br />
in <strong>the</strong> amount of streamflow data that has been col-<br />
Iected over this period. This study has attempted to improve<br />
this situation by<br />
al flood frequency<br />
analysis procedu<br />
<strong>the</strong> available<br />
annual and historical flo<br />
I catchments'<br />
The procedure, known as <strong>the</strong> Regional Flood Estimation<br />
(RFË) method, is applicable to both gauged and ungauged<br />
iural catchments which in general <strong>are</strong> greater than 20 km'<br />
in <strong>are</strong>a. Since <strong>the</strong> method was developed by averaging <strong>the</strong><br />
sampling variation that exists in individual flood records, it<br />
should provide a more reliable design flood peak estimate<br />
than that determined by fitting a frequency curve to a relatively<br />
short record.<br />
The RFE method comprises a set of eight regional flood<br />
frequency cu<br />
vs T, and a set of<br />
niné regionat<br />
when <strong>the</strong>re is little<br />
or no flood ¡<br />
S <strong>the</strong> T-Year flood,<br />
and Q is <strong>the</strong> mean annual flood. The most important independent<br />
variables in <strong>the</strong> equations <strong>are</strong> catchment <strong>are</strong>a<br />
and an index of <strong>the</strong> catchment rainfall.<br />
The regional curves may be used up to <strong>the</strong> 200-year return<br />
period to estimate a design flood peak, except in <strong>the</strong><br />
Otago-Southland region where <strong>the</strong> upper limit on return<br />
period is restricted to 100 years because of <strong>the</strong> limited data<br />
in this <strong>are</strong>a that were available <strong>for</strong> analysis. The curves <strong>are</strong><br />
defined by <strong>the</strong> straight-line extreme value type I (EVl) distribution<br />
<strong>for</strong> all but two of <strong>the</strong> regions <strong>the</strong> Bay of Plenty<br />
-<br />
and South Canterbury regions, where <strong>the</strong> extreme value<br />
type 2 (EV2) tlistribution was found to give a better definitión<br />
of <strong>the</strong> regional trend in <strong>the</strong> data. Although <strong>the</strong> general<br />
extreme value (C<br />
gional curves, th<br />
of <strong>the</strong> log-Pears<br />
tion tests carried<br />
that <strong>the</strong> LP3 distribution may well have given an equally<br />
good description of <strong>the</strong> curves.<br />
It is evident, both from <strong>the</strong> regional mass probability<br />
plots and from <strong>the</strong> standard error equations derived <strong>for</strong> <strong>the</strong><br />
iegional curves, that <strong>the</strong> variability in <strong>the</strong> regional Qr/Q<br />
data is well within acceptable limits. A quantitative indication<br />
of <strong>the</strong> confidence that may be placed on values of<br />
Q1/Q estimated fiom a regional curve is obtainable from<br />
<strong>the</strong> standard error equations which give estimates comparing<br />
very favourably with those given by <strong>the</strong> equivalent<br />
NERC (1975) equation.<br />
A feature of this study is <strong>the</strong> dependence of <strong>the</strong> results on<br />
climate. This is illustrated by <strong>the</strong> regions, which <strong>are</strong> partially<br />
consistent with recognised climatic boundaries, and<br />
by <strong>the</strong> difference in slope of <strong>the</strong> western and eastern regional<br />
curves. The latter curves have greater slopes, which<br />
ãre uttributable to <strong>the</strong> greater variability in <strong>the</strong> flood peak<br />
data <strong>for</strong> <strong>the</strong> eastern regions where <strong>the</strong> climate is drier and<br />
<strong>the</strong> antecedent conditions more variable. Fur<strong>the</strong>r indication<br />
of <strong>the</strong> climatic influence is given by <strong>the</strong> regional equations<br />
<strong>for</strong> estimating Q . ¡.lo physical characteristics, o<strong>the</strong>r than<br />
catchment <strong>are</strong>a, <strong>are</strong> included in <strong>the</strong> equations, <strong>the</strong> only<br />
o<strong>the</strong>r important parameters being catchment rainfall estimates.<br />
This suggests that climate may be <strong>the</strong> dominant factor<br />
affecting flood peaks with magnitude equal to or<br />
greater than <strong>the</strong> mean annual flood. O<strong>the</strong>r factors often<br />
considered important, such as geology and topography,<br />
have been accounted <strong>for</strong> to some extent in <strong>the</strong> regionalisation<br />
of <strong>the</strong> country.<br />
The country is divided into two sets of regions' one set<br />
<strong>for</strong> estimating Qr/Q and one <strong>for</strong> estimating Q. <strong>These</strong> <strong>are</strong><br />
very similar<br />
t<br />
tempts were<br />
e<br />
purposes, b<br />
t<br />
regions is a<br />
a<br />
Q1/Q and Q.<br />
The application_of <strong>the</strong> method to a catchment <strong>for</strong> <strong>the</strong><br />
estimation of Q1/Q and<br />
ted<br />
in Chapter 5 with four<br />
<strong>the</strong><br />
advantage, when only a<br />
of<br />
combining <strong>the</strong> estimates<br />
uation<br />
and <strong>the</strong> flood record to obtain a weighted average<br />
"best" estimate of Q . t¡e precision of each equation is expressed<br />
of record and,<br />
àepend<br />
estimate of Q<br />
from a<br />
he error of estimating<br />
od record. Thus<br />
when an important waterway project is being considered, a<br />
recorder should be installed as soon as possible to record<br />
<strong>the</strong> flood peaks.<br />
In addition to <strong>the</strong> regional curves of Q1/Q which extend<br />
up to a maximum of 200 years, generalised curves, one <strong>for</strong><br />
<strong>the</strong> west and one <strong>for</strong> <strong>the</strong> east, <strong>are</strong> given. <strong>These</strong> curves were<br />
derived from all <strong>the</strong> flood peak data collected <strong>for</strong> this<br />
study, excluding four extreme flood events, and <strong>the</strong>y can be<br />
applied from beyond <strong>the</strong> limit of <strong>the</strong> regional curves up to<br />
<strong>the</strong> 1000-year return period. Of interest is <strong>the</strong> marked similarity<br />
of <strong>the</strong>se curves with those derived by Stevens and<br />
ing too many regions. lt is envisaged that as more flood<br />
p.ãk dut" become available, revisions and refinements will<br />
te made to <strong>the</strong> RFE method' especially <strong>for</strong> <strong>the</strong> estimation<br />
of Q.<br />
In all cases, we recommend that o<strong>the</strong>r methods <strong>for</strong> estimating<br />
design flood magnitude also should be used and <strong>the</strong><br />
results comp<strong>are</strong>d be<strong>for</strong>e a final figure is selected'<br />
Water & soil technical publication no. 20 (1982)<br />
83


