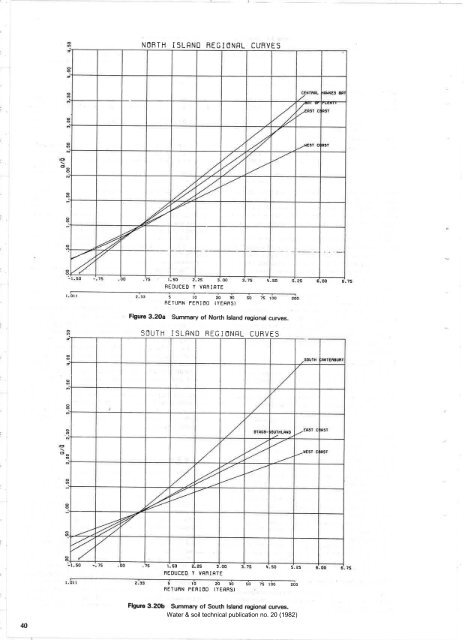
Tablo 3.4 Summary of <strong>the</strong> regional curve characteristics. Region Regional Curve Ordinates Regnl. Parameter Values <strong>for</strong> Eq. 3.14 or 3.23 O, sglO O¡/O O,o/õ Oro/O O.o/õ O,oo/O OrooiO Regional Cuwe Equation,OO = NORTH ISI.AND 1. Combined N.l. West Coast 1.OO 2. Bay of Plenty 0.96 3. N.l. East Coast 1.OO 4. Central Hawke's Bay 1.OO SOUTH ISI.AND 5. S.l. West Coast O.99 6. S.l. East Coast 1.OO 7. South Canterbury 1.OO 8. Otago-Southland O'98 1.30 1.55 1.31 1.62 1.43 1.78 1.49 1.89 1.22 1.41 1.31 1.56 1.52 1.95 1.33 1.62 1.78 2.09 1.96 2.46 2.12 2.56 2.27 2.77 1.59 1.82 1.80 2.12 2.39 2.94 1.89 2.25 2.32 2.55 2.87 3.33 2.89 3.21 3.14 3.51 1.99 2.16 2.35 2.58 3.44 3.91 2.51 0.804 0.330 0.762 0.325 0.726 0.469 0.696 0.s32 0.846 0.249 0.809 0.335 o.689 0.529 o.762 0.380 O.8O4 +O.33Oy -O.142 1.53O+2.292exp lO'142Y1 O.726 +0.469y 0.696 +O.532y O.846 +0.249y 0.8O9 +o.335y -O.O52 -9.545+10.234 exp (O.O52y) 0.762 +O.38Oy both regions, and to have included it in ei<strong>the</strong>r regional plot \r/ould bias <strong>the</strong> resulting regional curve; down\ryards in <strong>the</strong> case of <strong>the</strong> Bay of Plenty curve and upwards <strong>for</strong> <strong>the</strong> North Island East Coast curve. The Te Teko station was <strong>the</strong>re<strong>for</strong>e omitted from <strong>the</strong> derivation of <strong>the</strong> regional curve <strong>for</strong> both regions. Clearly, in deciding which regional curve to use <strong>for</strong> points on <strong>the</strong> Rangitaiki River system, consideration needs to be given to such factors as which region contains <strong>the</strong> greater proportion of <strong>the</strong> catchment <strong>are</strong>a, and whe<strong>the</strong>r <strong>the</strong> western or eastern part of <strong>the</strong> catchment contributes most to <strong>the</strong> peak flows at <strong>the</strong> point in question (see also section 5.2\. The number of stations near <strong>the</strong> eastern boundary of <strong>the</strong> Bay of Plenty region permitted such a detailed examination ofihe boundary line. In general, however, <strong>the</strong>re were insufficient stations to be able to do this' Most lines were subjectively defined and <strong>the</strong>y should be regarded as broad dividing iines between regions. To define <strong>the</strong> regional boundarils more precisely will require more flow stations with more flood peak data. 3.3.4 Final rog¡onal curves The final regional flood frequency curves that were derived <strong>are</strong> summarised in Figure 3'20. In general' <strong>the</strong> curves The excePtion is <strong>the</strong> minimal amount of gional curve Past 100 years, and <strong>the</strong> curve is tentative only. The ordinates Q'¡/Q <strong>for</strong> <strong>the</strong> final regional curves <strong>are</strong> listed in Table 3.4 <strong>for</strong> selected return periods. As well, <strong>the</strong> <strong>the</strong> eastern South Island <strong>are</strong>a identical to <strong>the</strong> annual flood regions defined f,or estimating Q (section 4.5). Regional plots correspondirng to <strong>the</strong> flood regions in <strong>the</strong> <strong>are</strong>a were constructed, but <strong>the</strong> data showed substantially greater variability than was evident in <strong>the</strong> plots <strong>for</strong> <strong>the</strong> original flood frequency regions, i.e., Regions 6, 7 and 8 in Figures 3'14- 3.16. Still pursuing <strong>the</strong> possibility of having consistent regions, all of <strong>the</strong> flood peak data <strong>for</strong> <strong>the</strong> three flood frequency regions were subsequently pooled toge<strong>the</strong>r, <strong>for</strong>ming a combined region known as <strong>the</strong> Eastern South Island region. The regional plot that was obtained <strong>for</strong> this <strong>are</strong>a, and <strong>the</strong> resulting regional curve, <strong>are</strong> shown in Figure 3'21. A comparison of this plot with those <strong>for</strong> <strong>the</strong> original three flood frequency regions (Figures 3.14-3.16) shows that <strong>the</strong> variability in <strong>the</strong> data <strong>for</strong> <strong>the</strong> combined region is much greater. This is borne out by <strong>the</strong> standard error equation developed <strong>for</strong> <strong>the</strong> regional curve of <strong>the</strong> combined <strong>are</strong>a which gave a C¡ I'alue at <strong>the</strong> 100-year return period, <strong>for</strong> example, that was 25 percent greater than that given by <strong>the</strong> group equation (llable 3.9) <strong>for</strong> <strong>the</strong> original regions (see section 3.4.1). This greater variability was <strong>not</strong> surprising in view of <strong>the</strong> range in <strong>the</strong> ordinates of <strong>the</strong> regional curves <strong>for</strong> <strong>the</strong> three regions. For instance, at <strong>the</strong> lü)-year return period <strong>the</strong> difference between <strong>the</strong> South Canterbury and South Island East Coast regional curve ordinates is l.l8' or 50 percent of <strong>the</strong> ordinate <strong>for</strong> <strong>the</strong> latter curve. Because of this iange, and <strong>the</strong> greater variability in <strong>the</strong> regional plot <strong>for</strong> <strong>the</strong> combined <strong>are</strong>a, tlhe curves <strong>for</strong> <strong>the</strong> three original regions offer a more accurate estimate of Q/Q <strong>for</strong> sites in <strong>the</strong> <strong>are</strong>a and <strong>the</strong> three regions were <strong>the</strong>re<strong>for</strong>e retained as <strong>the</strong> flood frequency regions. 3.3.5 Consistent regions For th <strong>the</strong> resul made of 3.3.6 Sub-reglons It will be <strong>not</strong>ed that two small <strong>are</strong>as in Figures 3.6 and 3.7 have been specially identifl¡ed as sub-regions. The first is that <strong>are</strong>a around Mt Egmont in <strong>the</strong> combined North Island West Coast region (see Figure 3'6). Flood peak data were available <strong>for</strong> onìly two stations in <strong>the</strong> <strong>are</strong>a, although each was associated u¡ith a representative basin. The catchment <strong>for</strong> <strong>the</strong> station on <strong>the</strong> east of <strong>the</strong> mountain (site 39504, Manganui River at Tariki Road) was included in <strong>the</strong> North Island West Coast region after its flood peak data were found to con<strong>for</strong>m very well with <strong>the</strong> regional flood frequency tr€nd. The second station (site 36001, Punehu River at Pihama) was located on <strong>the</strong> sou<strong>the</strong>rn side of <strong>the</strong> mountain. Its flood peak data displayed distinct upwards curvature on a probability plot, a trend markedly different from <strong>the</strong> regional one,, Because it was uncertain whe<strong>the</strong>r this was ase ofaPPlication of a real trend, or simply <strong>the</strong> result of using a short record an examination was (eight years), <strong>the</strong> sou<strong>the</strong>rn <strong>are</strong>a of Mt Egmont was excluded frequencY regions in from <strong>the</strong> North ltsland West Coast region' More flood peak Water & soil technical publication no. 20 (1982) 39
NOBTH ISLRND ßEGIONÊL CUBVES 1.50 2.?S 3. OO REDUCED Y VRBIßTE 2,33 sl02030 BETUBN FERIOO (YE8BS) 50 75 r00 Flgure 3.2Oa Summary of North lsland regional cury€s. SOUTH iSLÊND REGIONÊL CURVES 1.50 2-25 3.( BEOUCED Y VRBIFTE s r'o ¿'o g'o RETUNN PEBIOO IYERNS) 1t.50 5.2S so 7s t00 200 4 Fþure 3.2Ob Summary of South lsland regional curves. Water & soil technical publication no. 20 (1982)
- Page 1 and 2: WATER & SOIL TECHNICAL PUBLICATION
- Page 3 and 4: Regional flood est¡mat¡on in New
- Page 5 and 6: Tables 1.1 Risk ofexceedence for sp
- Page 7 and 8: Preface Water & soil technical publ
- Page 9 and 10: annual flood Q (the mean of the ann
- Page 11 and 12: Water & soil technical publication
- Page 13 and 14: Doto ovoiloble on TIDEDA Figure 2'1
- Page 15 and 16: P=45 O= 15 x4 (l) '= o o t.25 2'.O
- Page 17 and 18: Êv2 ( ko) Reduced Voriote y I'O t1
- Page 19 and 20: turn period. A plotting position fo
- Page 21 and 22: 'o ,l\, I zl l- I Water & soil tech
- Page 23 and 24: Table 3.2 Flow stat¡ons used. SITE
- Page 25 and 26: e process of examining the simtrend
- Page 27 and 28: Iì_ t_ I I I I I I I t-. I I tñ I
- Page 29 and 30: Þ I"IEST COFST 0 o I E 6o o o 25 3
- Page 31 and 32: SOUTHEBN REDUCEO Y VRBIßTE NETURN
- Page 33 and 34: SOUTH ISLFND HEST COFST I]ÊTR èo
- Page 35 and 36: SOUTH CÊNTERBURY DRTÊ NEOUCEO Y V
- Page 37 and 38: COMB I NED ,,IE5T CORST DRTR o rt
- Page 39: BÊY OF PLENTY DRTF o o o NEOUCEO Y
- Page 43 and 44: data for this area are required bef
- Page 45 and 46: NELSON REGIONFL CURVE BEOUCEO Y VRR
- Page 47 and 48: 46 EÊSTEFìN NEI,,I ZEFLÊND DÊTI
- Page 49 and 50: Table 3.9 The grouping and the grou
- Page 51 and 52: allowing curves rather than just st
- Page 53 and 54: 3.5.5 Extension method The NERC (19
- Page 55 and 56: Table 4.1 South lsland catchment ch
- Page 57 and 58: I 2 t l¡ 5 5 7 I 9 l0 t1 ,12 I5 1{
- Page 59 and 60: decided instead to use estimates of
- Page 61 and 62: \Í l{ I t, ìj( Fþurc 4.4 Distrib
- Page 63 and 64: 62 Fþurc 4,6 Logarithmic rcsidual
- Page 65 and 66: Table 4.6 Final equations for South
- Page 67 and 68: I ++ ++ * E 4.6 Analysis of North l
- Page 69 and 70: Non Pumice = õ = 3-24xto'6 AREA'7
- Page 71 and 72: Northlond f C"ro^ondel f Eost Cope
- Page 73 and 74: Table 4.11 Comparable equations for
- Page 75 and 76: Poo led cv Pooled o.40 F¡guro 4.12
- Page 77 and 78: mates of Cp typically range between
- Page 79 and 80: -J æ 'll o Eo !¡ Assemble llood p
- Page 81 and 82: Year 1958 1959 1960 l96r t962 1963
- Page 83 and 84: The estimate of Q from the regional
- Page 85 and 86: Water & soil technical publication
- Page 87 and 88: Maguiness, J.A.; Blackwood, P.L.; B
- Page 89 and 90: The liequency factor K is a functio
- Page 91 and 92:
e.9., Linsley et ol. (1915); lrish
- Page 93 and 94:
Maguiness, J.A.; Blackwood, P.L.; B
- Page 95 and 96:
sltt 930 t [rûltRÀict ¡ l? s;¡t
- Page 97 and 98:
3950't flrlÀRt R tr îlt¡Ît ;tP
- Page 99 and 100:
S ITI 29202 RuNttiltcl I ¡t tllEtt
- Page 101 and 102:
ïI-'_____ ::19: lt¡IPt0r n À1 i
- Page 103 and 104:
9100r GNE? R ¡T DOBSO| s¡18 93207
- Page 105 and 106:
6800 1 sBlrri R tT SrITEC¡,tttS 6I
- Page 107 and 108:
APPENDIX C Summary of tho data for
- Page 109 and 110:
oæ ON LAT. STATION NA ATION LAT. N
- Page 111 and 112:
o NUI,IBER HHAKAIIARU 854801 38 L7'
- Page 113 and 114:
l9 AT NU¡IB ËR AR',tËtlANA ÂRAI
- Page 115 and 116:
A ON LAT. STATION NA NUMBER AHUNA 5
- Page 117 and 118:
â NUI,IBER Lü{G.E ON NU14EER I,IU
- Page 119 and 120:
æ TATI ¡rouNT sor.tERS 7L740? 43
- Page 121 and 122:
N) o STATIoN NAr{gmLfï3---ffij NUI
- Page 123 and 124:
APPENDIX E Compadson of Regional Fl
- Page 125 and 126:
Table F.2 Flood peak data. NEW OTAG
- Page 127 and 128:
F.3 Analysis and results tatively p
- Page 129 and 130:
ét êt REOUCEO VßFIHTE 2. 33 5 l0
- Page 131 and 132:
SOLITH I EA l') COAST soUTH CANTERB
- Page 133 and 134:
0tiftflt a itÉitut5 ü¡. il/5 tg?
- Page 135:
Water & soil technical publication