

WATER & SOIL - These are not the droids you are looking for.
WATER & SOIL - These are not the droids you are looking for.
WATER & SOIL - These are not the droids you are looking for.

Create successful ePaper yourself
Turn your PDF publications into a flip-book with our unique Google optimized e-Paper software.
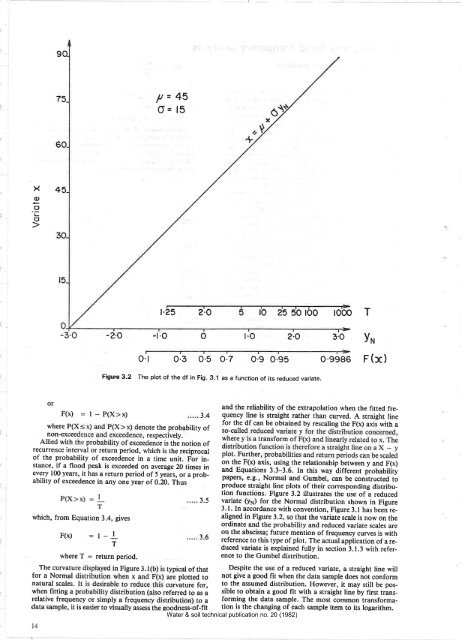
P=45<br />
O= 15<br />
x4<br />
(l)<br />
'=<br />
o<br />
o<br />
t.25 2'.O ¡b zs sb loo rooo T<br />
-z.o -t'o 2.O 3.O<br />
o.f o.3 0.5 0.7 0.9 0.95 o.9986<br />
YH<br />
F(x)<br />
Figure 3.2 The plot of <strong>the</strong> df in Fig. 3.1 as a function of its ¡educed variate,<br />
F(x) =l-P(X>x)<br />
34<br />
where P(<br />
ote <strong>the</strong> probability of<br />
non-exce<br />
respectively.<br />
Allied with<br />
dence is <strong>the</strong> <strong>not</strong>ion of<br />
recurrence interval or return period, which is <strong>the</strong> reciprocal<br />
of <strong>the</strong> probability of exceedence in a time unit. For instance,<br />
if a flood peak is exceeded on average 20 times in<br />
every 100 years, it has a return period of 5 years, or a probability<br />
of exceedence in any one year of 0.20. Thus<br />
P(X>x) = I T<br />
which, from Equation<br />
F(x) = I<br />
3.4, gives<br />
_l<br />
T<br />
whereT = returnperiod.<br />
The curvatu<br />
35<br />
36<br />
and <strong>the</strong> reliability of <strong>the</strong> extrapolation when <strong>the</strong> fitted frequency<br />
line is straight ra<strong>the</strong>r than curved. A straight line<br />
<strong>for</strong> <strong>the</strong> df can be obtained by rescaling <strong>the</strong> F(x) axiJ with a<br />
on <strong>the</strong> F(x) axis, using <strong>the</strong> relationship between y and F(x)<br />
and Equations 3.3-3.6. In this way different probability<br />
papers, e.g., Normal and Gumbel, can be constructed to<br />
produce straight line plots of <strong>the</strong>ir corresponding distribution<br />
functions. Figure 3.2 illustrates <strong>the</strong> use of a reduced<br />
yariate (y¡) <strong>for</strong> <strong>the</strong> Normal distribution shown in Figure<br />
3.1. In accordance with convention, Figure 3.1 has been realigned<br />
in Figure 3.2, so that <strong>the</strong> variate scale is now on <strong>the</strong><br />
ordinate and <strong>the</strong> probability and reduced variate scales <strong>are</strong><br />
on <strong>the</strong> abscissa; future mention of frequency curves is with<br />
reference to this type of plot. The actual application of a reduced<br />
variate is explained fully in section 3.1.3 with reference<br />
to <strong>the</strong> Gumbel distribution.<br />
typical ofthat Despite <strong>the</strong> use of a reduced variate, a straight line will<br />
<strong>for</strong> a Normal<br />
<strong>are</strong> plotted to <strong>not</strong> give a good fit when <strong>the</strong> data sample does <strong>not</strong> con<strong>for</strong>m<br />
natural scales.<br />
curvature <strong>for</strong>, to <strong>the</strong> assumed distribution. However, it may still be possible<br />
to obtain a good fit with a straight line by first trans-<br />
when fitting ã<br />
sferred to as a<br />
relative frequency or simply a frequency distribution) to a <strong>for</strong>ming <strong>the</strong> data sample. The most common trans<strong>for</strong>mation<br />
is <strong>the</strong> changing of each sample item to its logarithm.<br />
data sample, it is easier to visually assess <strong>the</strong> goodness-of-fit<br />
Water & soil technical publication no. 20 (1982)<br />
l4


