

WATER & SOIL - These are not the droids you are looking for.
WATER & SOIL - These are not the droids you are looking for.
WATER & SOIL - These are not the droids you are looking for.

Create successful ePaper yourself
Turn your PDF publications into a flip-book with our unique Google optimized e-Paper software.
3.?A, <strong>the</strong> variance of <strong>the</strong> flood peak estimate Q.¡ may be<br />
given as (NERC 1975, p.184)<br />
var(Qr) : var_(Q.Qr/Q) _<br />
= E(Q)'.var(Qr/_Q)<br />
+ E(Qr/Q)'?.var(Q)<br />
325<br />
The quantity var(Q ) on <strong>the</strong> right han_d side of Equation<br />
3.25 depends on <strong>the</strong> manner in which Q is estimated (see<br />
Chapter 4). In practice Q is substituted <strong>for</strong> E(Q ) and, similarly,<br />
QrlQ <strong>for</strong> E(Q1/Q). This leaves only <strong>the</strong> quantity<br />
var (Qr/Q) unaccounted <strong>for</strong>. It is <strong>the</strong> variance of <strong>the</strong> regional<br />
curve ordinate Q.¡/Q at return period T and is <strong>the</strong><br />
type (b) variation mentioned previously.<br />
The quantity var (Q1/Q ) was calculated as <strong>the</strong> variance<br />
of <strong>the</strong> individual station flood frequency curves <strong>for</strong><br />
T=2.33,5, 10,20,30, 50 and 100 years. Given this variance,<br />
<strong>the</strong> coefficient of variation (Cp) of individual station<br />
curves about <strong>the</strong> regional curve is defined as<br />
c¡ = (var (Qr/Q) )k/(Qr/Q) 326<br />
and is a measure of <strong>the</strong> type (b) variation above'<br />
Regression analyses of C¡ against <strong>the</strong> return period T,<br />
and also fnT, were carried out and it was found that <strong>the</strong> relationships<br />
between C¡ and /nT were approximately linear.<br />
Regression equations of <strong>the</strong> <strong>for</strong>m<br />
Cp=(c+m./nT)/100 321<br />
were <strong>the</strong>re<strong>for</strong>e obtained, where c and m <strong>are</strong> constants <strong>for</strong> a<br />
reglon.<br />
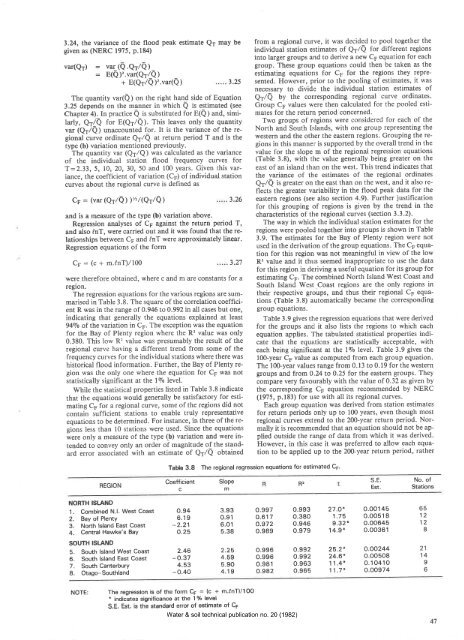
The regression equations <strong>for</strong> <strong>the</strong> various regions <strong>are</strong> summarised<br />
in Table 3.8. The squ<strong>are</strong> of <strong>the</strong> correlation coefficient<br />
R was in <strong>the</strong> range of 0.946 to 0.992 in all cases but one,<br />
indicating that generally <strong>the</strong> equations explained at least<br />
9490 of <strong>the</strong> variation in C¡. The exception was <strong>the</strong> equation<br />
<strong>for</strong> <strong>the</strong> Bay of Plenty region where <strong>the</strong> R'z value was only<br />
0.380. This low R' value was presumably <strong>the</strong> result of <strong>the</strong><br />
regional curve having a different trend from some of <strong>the</strong><br />
frequency curves <strong>for</strong> <strong>the</strong> individual stations where <strong>the</strong>re was<br />
historical flood in<strong>for</strong>mation. Fur<strong>the</strong>r, <strong>the</strong> Bay of Plenty region<br />
was <strong>the</strong> only one where <strong>the</strong> equation <strong>for</strong> CF was <strong>not</strong><br />
statistically significant at <strong>the</strong> l9o level.<br />
While <strong>the</strong> statistical properties listed in Table 3'8 indicate<br />
that <strong>the</strong> equations would generally be satisfactory <strong>for</strong> estimating<br />
C¡ <strong>for</strong> a regional curve, some of <strong>the</strong> regions did <strong>not</strong><br />
contain sufficient stations to enable truly representative<br />
equations to be determined. For instance, in three of<strong>the</strong> regiòns<br />
less than l0 stations were used. Since <strong>the</strong> equations<br />
were only a measure of <strong>the</strong> type (b) variation and were intended<br />
to convey only an order of magnitude of<strong>the</strong> standard<br />
error associated with an estimate of Q'¡/Q obtained<br />
from a regional curve, it was decided to pool toge<strong>the</strong>r <strong>the</strong><br />
individual station estimates of Q1/Q <strong>for</strong> different regions<br />
into larger groups and to derive a new C¡ equation <strong>for</strong> each<br />
group. <strong>These</strong> grou¡r equations could <strong>the</strong>n be taken as <strong>the</strong><br />
estimating equatiorrs <strong>for</strong> C¡ <strong>for</strong> <strong>the</strong> regions <strong>the</strong>y represented.<br />
However, prior to <strong>the</strong> pooling of estimates, it was<br />
necessary to dividr: <strong>the</strong> individual station estimates of<br />
Qr/Q bv <strong>the</strong> corresponding regional curve ordinates.<br />
Group C¡ values were <strong>the</strong>n calculated <strong>for</strong> <strong>the</strong> pooled estimates<br />
<strong>for</strong> <strong>the</strong> return period concerned.<br />
Two groups of regions were considered <strong>for</strong> each of <strong>the</strong><br />
North and South Islands, with one group representing <strong>the</strong><br />
western and <strong>the</strong> o<strong>the</strong>r <strong>the</strong> eastern regions. Grouping <strong>the</strong> regions<br />
in this mannen is supported by <strong>the</strong> overall trend in <strong>the</strong><br />
value <strong>for</strong> <strong>the</strong> slope m of <strong>the</strong> regional regression equations<br />
(Table 3.8), with <strong>the</strong> value generally being greater on <strong>the</strong><br />
east of an island than on <strong>the</strong> west. This trend indicates that<br />
<strong>the</strong> variance of <strong>the</strong> estimates of <strong>the</strong> regional ordinates<br />
Q-¡/Q is greater on <strong>the</strong> east than on <strong>the</strong> west, and it also reflects<br />
<strong>the</strong> greater variability in <strong>the</strong> flood peak data <strong>for</strong> <strong>the</strong><br />
eastern regions (see also section 4.9). Fur<strong>the</strong>r justification<br />
<strong>for</strong> this grouping of regions is given by <strong>the</strong> trend in <strong>the</strong><br />
characteristics of ttre regional curves (section 3.3.2).<br />
The way in which <strong>the</strong> individual station estimates <strong>for</strong> <strong>the</strong><br />
regions were pooled toge<strong>the</strong>r into groups is shown in Table<br />
3.9. The estimates <strong>for</strong> <strong>the</strong> Bay of Plenty region were <strong>not</strong><br />
used in <strong>the</strong> derivation of <strong>the</strong> group equations. The C¡ equation<br />
<strong>for</strong> this region was <strong>not</strong> meaningful in view of <strong>the</strong> low<br />
R2 value and it thurs seemed inappropriate to use <strong>the</strong> data<br />
<strong>for</strong> this region in deriving a useful equation <strong>for</strong> its group <strong>for</strong><br />
estimating C¡. The combined North Island West Coast and<br />
South Island West Coast regions <strong>are</strong> <strong>the</strong> only regions in<br />
<strong>the</strong>ir respective groups, and thus <strong>the</strong>ir regional C¡ eQuations<br />
(Table 3.8) automatically became <strong>the</strong> corresponding<br />
group equations.<br />
Table 3.9 gives thre regression equations that were derived<br />
<strong>for</strong> <strong>the</strong> groups andt it also lists <strong>the</strong> regions to which each<br />
equation applies. The tabulated statistical properties indicate<br />
that <strong>the</strong> equa,tions <strong>are</strong> statistically acceptable, with<br />
each being significant at <strong>the</strong> l9o level. Table 3.9 gives <strong>the</strong><br />
100-year C¡ value as computed from each group equation.<br />
The 1OO-year values range from 0.13 to 0.19 <strong>for</strong> <strong>the</strong> western<br />
groups and from O.24to 0.25 <strong>for</strong> <strong>the</strong> eastern groups. They<br />
comp<strong>are</strong> very favourably with <strong>the</strong> value of 0.32 as given by<br />
<strong>the</strong> corresponding Cp equation recommended by NERC<br />
(1975, p.183) <strong>for</strong> use with all its regional curves.<br />
Each group equation was derived from station estimates<br />
<strong>for</strong> return periods only up to 100 years, even though most<br />
regional curves extend to <strong>the</strong> 2(Ð-year return period. Normally<br />
it is recommended that an equation should <strong>not</strong> be applied<br />
outside <strong>the</strong> range of data from which it was derived.<br />
However, in this case it was preferred to allow each equation<br />
to be applied up to <strong>the</strong> 2D-year return period, ra<strong>the</strong>r<br />
Table 3.8 The regional regression equations <strong>for</strong> estimated CF'<br />
REGION<br />
Coefficient<br />
c<br />
S ope<br />
m<br />
R2<br />
s.E.<br />
Est.<br />
No. ol<br />
Stat¡ons<br />
NORTH ISTAND<br />
1. Combined N.l. West Coast<br />
2. Bay of Plenty<br />
3. North lsland East Coast<br />
4. Central Hawke's Bay<br />
o.94<br />
6.19<br />
-2.21<br />
o.25<br />
3.93<br />
o.91<br />
6.O1<br />
5.38<br />
0.997<br />
0.617<br />
o.972<br />
o.989<br />
o.993<br />
0.380<br />
o.946<br />
o.979<br />
27.O* O.OO145<br />
1.75 0.Oo518<br />
9.32* 0.00645<br />
14.9* 0.00361<br />
65<br />
12<br />
12<br />
8<br />
SOUTH ISI-AND<br />
5. South lsland West Coast<br />
6. South lsland East Coast<br />
7. South Canterbury<br />
8. Otago-Southland<br />
2.46<br />
-o.37<br />
4.53<br />
-o.40<br />
2.25<br />
4.59<br />
5.90<br />
4.19<br />
0.996<br />
o.996<br />
0.981<br />
o.982<br />
o.992<br />
0.992<br />
0.963<br />
o.965<br />
25.2* o.oo244<br />
24.6* O.OO508<br />
1 1 .4* 0.10410<br />
11.7* O.OO974<br />
21<br />
14<br />
9<br />
t)<br />
NOTE:<br />
The regression is of <strong>the</strong> <strong>for</strong>m C¡ = (c + m.fnT)/lOO<br />
* ¡ndicates significance at <strong>the</strong> 196 level<br />
S.E. Est. is <strong>the</strong> standard error of est¡mate of C¡<br />
Water & soil technical publication no. 20 (1982)<br />
47


