

WATER & SOIL - These are not the droids you are looking for.
WATER & SOIL - These are not the droids you are looking for.
WATER & SOIL - These are not the droids you are looking for.

Create successful ePaper yourself
Turn your PDF publications into a flip-book with our unique Google optimized e-Paper software.
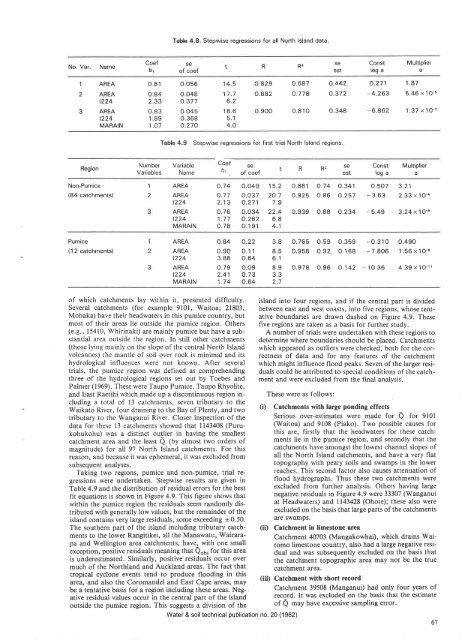
Table 4.8. Stepwise regressions <strong>for</strong> all North lsland data.<br />
No. Var. Name<br />
Coef<br />
br<br />
se<br />
of coef<br />
R2<br />
se<br />
est<br />
Const<br />
log a<br />
Multiplier<br />
a<br />
1<br />
2<br />
AREA<br />
AREA<br />
t224<br />
AREA<br />
t224<br />
MARAIN<br />
o.81<br />
0.84<br />
2.33<br />
o.83<br />
1.89<br />
1.O7<br />
o.o56<br />
0.048<br />
o.377<br />
o.045<br />
o.368<br />
o.270<br />
14.5<br />
17.7<br />
6.2<br />
18.6<br />
5.1<br />
4.O<br />
0.829<br />
o.882<br />
o.900<br />
o.687<br />
o.778<br />
o.810<br />
o.442<br />
o.372<br />
o.348<br />
0.271 1 .87<br />
-4.263 5.46 x 1O-õ<br />
- 6.862 1 .37 x 10'<br />
Table 4.9 Stepwise regressions <strong>for</strong> first trial North lsland regions<br />
Region<br />
Number Variable<br />
Variables Name<br />
Coef<br />
b'<br />
se<br />
of coef<br />
R2<br />
se<br />
est<br />
Const Mult¡plier<br />
loga a<br />
Non-Pumice<br />
(84 catchments)<br />
1<br />
2<br />
AREA<br />
AREA<br />
t224<br />
AREA<br />
t224<br />
MARAIN<br />
o.74 0.049<br />
o.77 0.037<br />
2.13 0.271<br />
o.76 0.034<br />
1.77 0.262<br />
0.78 0. 1 91<br />
'15.2 0.861 0.74 0.341<br />
20.7 0.925 0.86 0.257<br />
7.9<br />
22.4 0.939 0.88 0.234<br />
6.8<br />
4.1<br />
0.507 3.21<br />
- 3.63 2.33 x 1O-a<br />
- 5.49 3.24 x 1O-o<br />
Pumice<br />
( 1 2 catchments)<br />
1<br />
2<br />
AREA<br />
AREA<br />
t224<br />
AREA<br />
t224<br />
MARAIN<br />
o.84 0.22<br />
0.90 0.11<br />
3.88 0.64<br />
o.79 0.o9<br />
2.41 0.73<br />
1.74 0.64<br />
3.8 0.765<br />
8.5 0.958<br />
6.1<br />
8.9 0.978<br />
3.3<br />
2.7<br />
o.59 0.359 -O.310 0.490<br />
O.92 0.168 -7.806 1.56 x 1O-8<br />
0.96 O.142 - 10.36 4.39 x 1Oi1<br />
of which catchments lay within it, presented difficulty.<br />
Several catchments (<strong>for</strong> example 9101, Waitoa; 21803,<br />
Mohaka) have <strong>the</strong>ir headwaters in this pumice country, but<br />
most of <strong>the</strong>ir <strong>are</strong>as lie outside <strong>the</strong> pumice region. O<strong>the</strong>rs<br />
(e.g., 15410, Whirinaki) <strong>are</strong> mainly pumice but have a substantial<br />
<strong>are</strong>a outside <strong>the</strong> region. In still o<strong>the</strong>r catchments<br />
(those lying mainly on <strong>the</strong> slope of <strong>the</strong> central North Island<br />
volcanoes) <strong>the</strong> mantle of soil over rock is minimal and its<br />
hydrological influences were <strong>not</strong> known. After several<br />
trials, <strong>the</strong> pumice region was defined as comprehending<br />
three of <strong>the</strong> hydrological regions set out by Toebes and<br />
Palmer (1969). <strong>These</strong> were Taupo Pumice, Taupo Rhyolite,<br />
and East Raetihi which made up a discontinuous region including<br />
a total of 13 catchments, seven tributary to <strong>the</strong><br />
Waikato River, four draining to <strong>the</strong> Bay of Plenty, and two<br />
tributary to <strong>the</strong> Wanganui River. Closer inspection of <strong>the</strong><br />
data <strong>for</strong> <strong>the</strong>se l3 catchments showed that 11432108 (Purukohukohu)<br />
was a distinct outlier in having <strong>the</strong> smallest<br />
catchment <strong>are</strong>a and <strong>the</strong> least Q (by almost two orders of<br />
magnitude) <strong>for</strong> all 97 North Island catchments. For this<br />
reason, and because it was ephemeral, it was excluded from<br />
subsequent analyses.<br />
Taking two regions, pumice and non-pumice, trial regressions<br />
were undertaken. Stepwise results <strong>are</strong> given in<br />
Table 4.9 and <strong>the</strong> distribution of residual errors <strong>for</strong> <strong>the</strong> best<br />
fit equations is shown in Figure 4.9. This figure shows that<br />
within <strong>the</strong> pumice region <strong>the</strong> residuals seem randomly distributed<br />
with generally low values, but <strong>the</strong> remainder of <strong>the</strong><br />
island contains very large residuals, some exceeding I 0.50.<br />
The sou<strong>the</strong>rn part of <strong>the</strong> island including tributary catchments<br />
to <strong>the</strong> lower Rangitikei, all <strong>the</strong> Manawatu, Wairarapa<br />
and Wellington <strong>are</strong>a catchments, have, with one small<br />
exception, positive residuals meaning that Qo5, <strong>for</strong> this <strong>are</strong>a<br />
is underestimated. Similarly, positive residuals occur over<br />
much of <strong>the</strong> Northland and Auckland <strong>are</strong>as. The fact that<br />
tropical cyclone events tend to produce flooding in this<br />
<strong>are</strong>a, and also <strong>the</strong> Coromandel and East Cape <strong>are</strong>as, may<br />
be a tentative basis <strong>for</strong> a region including <strong>the</strong>se <strong>are</strong>as. Negative<br />
residual values occur in <strong>the</strong> central part of <strong>the</strong> island<br />
outside <strong>the</strong> pumice region. This suggests a division of <strong>the</strong><br />
Water & soil technical publication no. 20 (1982)<br />
island into four regions, and if <strong>the</strong> central part is divided<br />
between east and west coasts, into five regions, whose tentative<br />
boundaries <strong>are</strong> drawn dashed on Figure 4.9. <strong>These</strong><br />
five regions <strong>are</strong> taken as a basis <strong>for</strong> fur<strong>the</strong>r study.<br />
A number of trials were undertaken with <strong>the</strong>se regions to<br />
determine where boundaries should be placed. Catchments<br />
which appe<strong>are</strong>d as outliers were checked, both <strong>for</strong> <strong>the</strong> correctness<br />
of data and <strong>for</strong> any features of <strong>the</strong> catchment<br />
which might influence flood peaks. Seven of <strong>the</strong> larger residuals<br />
could be attributed to special conditions of <strong>the</strong> catchment<br />
and were excluded from <strong>the</strong> final analysis.<br />
<strong>These</strong> were as follows:<br />
(i) C¡tchments with large ponding effects<br />
Serious over-estimates were made <strong>for</strong> Q <strong>for</strong> 9l0l<br />
(Waitoa) and 9108 (Piako). Two possible causes <strong>for</strong><br />
this <strong>are</strong>, firslly that <strong>the</strong> headwaters <strong>for</strong> <strong>the</strong>se catchments<br />
lie in <strong>the</strong> pumice region, and secondly that <strong>the</strong><br />
catchments have amongst <strong>the</strong> lowest channel slopes of<br />
all <strong>the</strong> North Island catchments, and have a very flat<br />
topography with peaty soils and swamps in <strong>the</strong> lower<br />
reaches. This second factor also causes attenuation of<br />
flood hydrographs. Thus <strong>the</strong>se two catchments were<br />
excluded frorn fur<strong>the</strong>r analysis. O<strong>the</strong>rs having large<br />
negative residuals in Figure 4.9 were 33307 (Wanganui<br />
at Headwaters) and 1143428 (Ohote); <strong>the</strong>se also were<br />
excluded on <strong>the</strong> basis that large parts of <strong>the</strong> catchments<br />
<strong>are</strong> swamps.<br />
(ii) C¡tchment in l¡mestone <strong>are</strong>a<br />
Catchment 40703 (Mangakowhai), which drains Waitomo<br />
limestone country, also had a large negative residual<br />
and was subsequently excluded on <strong>the</strong> basis that<br />
<strong>the</strong> catchment topographic <strong>are</strong>a may <strong>not</strong> be <strong>the</strong> true<br />
catchment <strong>are</strong>a.<br />
(iii) Catchment with short record<br />
Catchment 39508 (Manganui) had only four years of<br />
record. It was excluded on <strong>the</strong> basis that <strong>the</strong> estimate<br />
of Q may have excessive sampling error.<br />
67


