WATER & SOIL - These are not the droids you are looking for.
WATER & SOIL - These are not the droids you are looking for.
WATER & SOIL - These are not the droids you are looking for.
You also want an ePaper? Increase the reach of your titles
YUMPU automatically turns print PDFs into web optimized ePapers that Google loves.
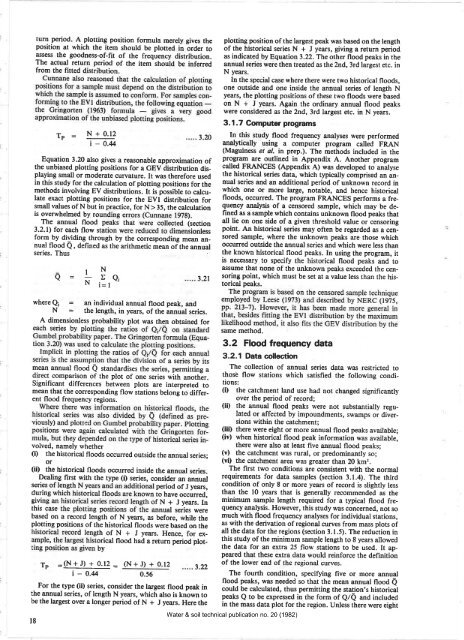
turn period. A plotting position <strong>for</strong>mula merely gives <strong>the</strong><br />
position at which <strong>the</strong> item should be plotted in order to<br />
assess <strong>the</strong> goodness-of-fit of <strong>the</strong> frequency distribution.<br />
The actual return period of <strong>the</strong> item should be inferred<br />
from <strong>the</strong> fitted distribution.<br />
TP N + 0.12<br />
i-0.4<br />
Equation 3.20 also gives a reasonable approximation of<br />
<strong>the</strong> unbiased plotting positions <strong>for</strong> a GEV distribution displaying<br />
small or moderate curvature. It was <strong>the</strong>re<strong>for</strong>e used<br />
in this study <strong>for</strong> <strong>the</strong> calculation of plotting positions <strong>for</strong> <strong>the</strong><br />
methods involving EV distributions. It is possible to calculate<br />
exact plotting positions <strong>for</strong> <strong>the</strong> EVI distribution <strong>for</strong><br />
small values of N but in practice, <strong>for</strong> N ) 35, <strong>the</strong> calculation<br />
is overwhelmed by ro<br />
a<br />
,N<br />
" a' iD=, 321<br />
320<br />
S).<br />
(section<br />
where Q¡ an individual annual flood peak, and<br />
N <strong>the</strong> length, in years, of <strong>the</strong> annual series.<br />
A dimensionless probability plot was <strong>the</strong>n obtained <strong>for</strong><br />
The annual flood<br />
3.2.1) <strong>for</strong> each flow s ¡sionless<br />
<strong>for</strong>m by dividing through by <strong>the</strong> corresponding mean annual<br />
flood Q, defined as <strong>the</strong> arithmetic mean of <strong>the</strong> annual<br />
series. Thus<br />
mean annual flood Q standardises <strong>the</strong> series, permitting a<br />
direct comparison of <strong>the</strong> plot of one series with a<strong>not</strong>hèr.<br />
Significant differences between plots <strong>are</strong> interpreted to<br />
mean that <strong>the</strong> corresponding ftow stations belong to different<br />
flood frequency regions.<br />
volved, namely whe<strong>the</strong>r<br />
(D <strong>the</strong> historical floods occurred outside <strong>the</strong> annual series;<br />
or<br />
(ii) tne historical floods occurred inside <strong>the</strong> annual series.<br />
Dealing first with <strong>the</strong> type (i) series, consider an annual<br />
period of J years,<br />
to have occurred,<br />
seri<br />
dur<br />
givi<br />
fN+Jyears.In<br />
this<br />
nnual seiies were<br />
based on a record length of N years, as be<strong>for</strong>e, while <strong>the</strong><br />
plotting positions of <strong>the</strong> historical floods were based on <strong>the</strong><br />
th of N + J years. Hence, <strong>for</strong> exorical<br />
flood had a return period plotby<br />
TP :(N + J) + 0.12 =<br />
i-o.4<br />
(N+J) + 0.t2 322<br />
0.56<br />
For <strong>the</strong> type (ii) series, consider <strong>the</strong> largest flood peak in<br />
<strong>the</strong> annual series, of length N years, which also is known to<br />
be <strong>the</strong> largest over a longer period of N + J years. Here <strong>the</strong><br />
t8<br />
plotting position of <strong>the</strong> largest peak was based on <strong>the</strong> length<br />
of <strong>the</strong> historical series N + J years, giving a return period<br />
as indicated by Equation 3.22. The o<strong>the</strong>r flood peaks in <strong>the</strong><br />
annual series were <strong>the</strong>n treated as <strong>the</strong> 2nd, 3rd largest etc. in<br />
N years.<br />
In <strong>the</strong> special case where <strong>the</strong>re were two historical floods,<br />
one outside and one inside <strong>the</strong> annual series of length N<br />
years, <strong>the</strong> plotting positions of <strong>the</strong>se two floods were based<br />
on N + J years. Again <strong>the</strong> ordinary annual flood peaks<br />
were considered as <strong>the</strong> 2nd, 3rd largest etc. in N years.<br />
3. 1.7 Computer programs<br />
In this study flood frequency analyses were per<strong>for</strong>med<br />
analytically using a computer program called FRAN<br />
(Maguiness et al. in prep.). The methods included in <strong>the</strong><br />
program <strong>are</strong> outlined in Appendix A. A<strong>not</strong>her program<br />
called FRANCES (Appendix A) was developed ro analyse<br />
<strong>the</strong> historical series data, which typically comprised an annual<br />
series and an additional period of unknown record in<br />
which one or more large, <strong>not</strong>able, and hence historical<br />
floods, occurred. The program FRANCES per<strong>for</strong>ms a frequency<br />
analysis of a censored sample, which may be defined<br />
as a sample which contains unknown flood peaks that<br />
all lie on one side of a given threshold value or censoring<br />
point. An historical series may often be regarded as a censored<br />
sample, where <strong>the</strong> unknown peaks <strong>are</strong> those which<br />
occurred outside <strong>the</strong> annual series and which were less than<br />
<strong>the</strong> known historical flood peaks. In using <strong>the</strong> program, it<br />
is necessary to specify <strong>the</strong> historical flood peaks and to<br />
assume that none of <strong>the</strong> unknown peaks exceeded <strong>the</strong> censoring<br />
point, which must be set at a value less than <strong>the</strong> historical<br />
peaks.<br />
same method.<br />
3.2 Flood frequency data<br />
3.2.1 Data collect¡on<br />
The collection of annual series data was restricted to<br />
thosè flow stations which satisfied <strong>the</strong> following conditions:<br />
(i) <strong>the</strong> catchment land use had <strong>not</strong> changed significantly<br />
over <strong>the</strong> period of record;<br />
(ii) <strong>the</strong> annual flood peaks were <strong>not</strong> substantially regulated<br />
or affected by impoundments, swamps or diversions<br />
within <strong>the</strong> catchment;<br />
(iii) <strong>the</strong>re were eight or more annual flood peaks available;<br />
(iv) when historicat flood peak in<strong>for</strong>mation was available,<br />
<strong>the</strong>re were also at least five annual flood peaks;<br />
(v) <strong>the</strong> catchment was rural, or predominantly so;<br />
(vl) <strong>the</strong> catchment <strong>are</strong>a was greater than 20 kmr.<br />
The first two conditions <strong>are</strong> consistent with <strong>the</strong> normal<br />
requirements <strong>for</strong> data samples (section 3.1.4). The third<br />
condition of only 8 or more years of record is slightly less<br />
than <strong>the</strong> l0 years that is generally recommended as <strong>the</strong><br />
minimum sample length required <strong>for</strong> a typical flood frequency<br />
analysis. However, this study was concerned, <strong>not</strong> so<br />
much with flood frequency analyses <strong>for</strong> individual stations,<br />
as with <strong>the</strong> derivation of regional curves from mass plots of<br />
all <strong>the</strong> data <strong>for</strong> <strong>the</strong> regions (section 3.1.5). The reduction in<br />
this study of <strong>the</strong> minimum sample length to 8 years allowed<br />
<strong>the</strong> data <strong>for</strong> an extra 25 ftow stations to be used. It appe<strong>are</strong>d<br />
that <strong>the</strong>se extra data would rein<strong>for</strong>ce <strong>the</strong> definition<br />
of <strong>the</strong> lower end of <strong>the</strong> regional curves.<br />
The fourth condition, specifying five or more annual<br />
flood peaks, was needed so that <strong>the</strong> mean annual flood Q<br />
could be calculated, thus permitting <strong>the</strong> station,s historical<br />
peaks Q to be expressed in <strong>the</strong> <strong>for</strong>m of Q/Q and included<br />
in <strong>the</strong> mass data plot <strong>for</strong> <strong>the</strong> region. Unless <strong>the</strong>re were eight<br />
Water & soil technical publication no. 20 (1982)


