

WATER & SOIL - These are not the droids you are looking for.
WATER & SOIL - These are not the droids you are looking for.
WATER & SOIL - These are not the droids you are looking for.

You also want an ePaper? Increase the reach of your titles
YUMPU automatically turns print PDFs into web optimized ePapers that Google loves.
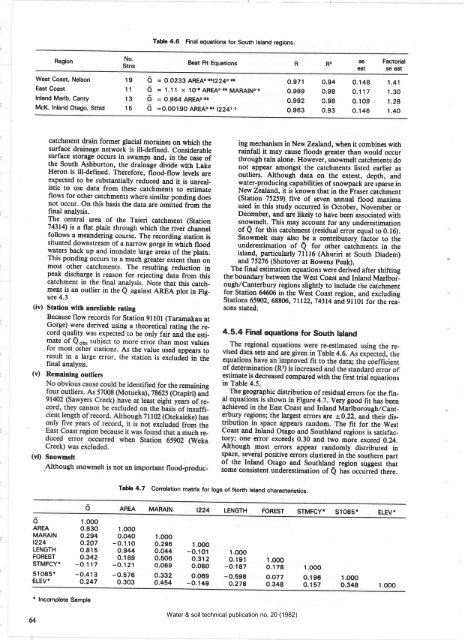
Table 4.6 Final equations <strong>for</strong> South lsland regions.<br />
Region<br />
West Coast. Nelson<br />
East Coast<br />
lnland Marlb, Canty<br />
McK, lnland Otago, Sthld<br />
No.<br />
Stns<br />
19<br />
11<br />
13<br />
15<br />
õ<br />
õ<br />
õ<br />
õ<br />
B€st Fh Equations R2<br />
Se<br />
est<br />
= 0,0233 AREAo...l224o.e¡<br />
= 1,1 1 x lo-e AREAo ¡e MARA|N3.o<br />
= 0.964 AREAo.¡o<br />
=o.oo1 90 AREAo.el 12241,3<br />
o.971<br />
o.989<br />
0.992<br />
o.963<br />
0.94<br />
o.98<br />
0.98<br />
o.93<br />
Factorial<br />
se €8t<br />
0.1 48 1 .41<br />
0.117 1.30<br />
0.1 09 1 .28<br />
o.1 46 1 .40<br />
catchm€nt drain <strong>for</strong>mer glacial moraines on s,hich <strong>the</strong><br />
surface drainage network is ill-defined. Considerable<br />
surface storage occurs in swamps and, in <strong>the</strong> case of<br />
<strong>the</strong> South Ashburton, <strong>the</strong> drainage divide with Lake<br />
Heron is ill-defined. There<strong>for</strong>e, flood-flow levels <strong>are</strong><br />
expected to be substantially reduced and it is uûeal_<br />
istic to use data from <strong>the</strong>se catchments to estimate<br />
flows <strong>for</strong> o<strong>the</strong>r catchments where similar ponding does<br />
<strong>not</strong> occur. On this basis <strong>the</strong> data <strong>are</strong> omitted from <strong>the</strong><br />
final analysis.<br />
The central <strong>are</strong>a of <strong>the</strong> Taieri catchment (Station<br />
74314) is a flat plain through which <strong>the</strong> river channel<br />
follows a meandering course. The recording station is<br />
situated downstream of a narrow gorge in which flood<br />
waters back up and inundate large <strong>are</strong>as of <strong>the</strong> plain.<br />
This ponding occurs to a much greater extent thãn on<br />
most o<strong>the</strong>r catchments. The resulting reduction in<br />
peak discharge is reason <strong>for</strong> rejecting data from this<br />
catchment in <strong>the</strong> final analysis. Note that this catch_<br />
ment is an outlier in <strong>the</strong> Q against AREA plot in Fig_<br />
ure 4.3<br />
(iv) Station wlth unreliable rating<br />
Because flow records <strong>for</strong> Station 9ll0l (Taramakau at<br />
Gorge) were derived using a <strong>the</strong>oretical rating <strong>the</strong> re_<br />
cord qualìty was expected to be only fair andihe esti_<br />
mate of Qo6, subject to more error than most values<br />
<strong>for</strong> most o<strong>the</strong>r stations. As <strong>the</strong> value used appears to<br />
result in a large error, <strong>the</strong> station is excludeã in <strong>the</strong><br />
final analysis.<br />
(v) Remaining outliers<br />
(vi) Snowmelt<br />
Although snowmelt is <strong>not</strong> an important flood-producing<br />
mechanism in New Zealand, when it combines with<br />
rainfall it may cause floods greater than would occur<br />
through rain alone. However, snowmelt catchments do<br />
<strong>not</strong> appear aniongst <strong>the</strong> catchments listed earlier as<br />
outliers. Although data on <strong>the</strong> extert, depth, and<br />
water-producing capabilities of snowpack <strong>are</strong> sparse in<br />
New Zealand, it is known that in <strong>the</strong> Fraser catchment<br />
(Station 75259) five of seven annual flood maxima<br />
us€d in this study occurred in October, November or<br />
Decernber, and <strong>are</strong> likely to have been associated with<br />
snorvmelt. This may account <strong>for</strong> any underestimation<br />
of Q <strong>for</strong> this catchment (residual error equal to 0. 16).<br />
Snowmelt may also be a contributory factor to <strong>the</strong><br />
underestimation of Q <strong>for</strong> o<strong>the</strong>r catchments in <strong>the</strong><br />
island, paticularly 71116 (Ahuriri at South Diadem)<br />
and75276 (Shotover at Bowens peak).<br />
The final estimation equations were derived after shifting<br />
<strong>the</strong> boundary between <strong>the</strong> West Coast and Inland Marlborough/Canterbury<br />
regions slightly lo include <strong>the</strong> catchment<br />
<strong>for</strong> Station 64ó06 in <strong>the</strong> West Coast region, and excluding<br />
Stations 65902, 68806, 71122,74314 and 9ll0l <strong>for</strong> <strong>the</strong> reasons<br />
stated.<br />
4,5.4 Final equations <strong>for</strong> South lsland<br />
estimate is decreased comp<strong>are</strong>d with <strong>the</strong> first trial equations<br />
in Table 4.5.<br />
The geographic distribution of residual errors <strong>for</strong> <strong>the</strong> fin_<br />
4.7. Yery good fit has been<br />
Inland Marlborough/Cantrs<br />
<strong>are</strong> +0.22, and <strong>the</strong>ir disdom.<br />
The fÏt <strong>for</strong> <strong>the</strong> W€st<br />
Coast and Inland Otago and Southland regions is satisfactory;<br />
one error exceeds 0.30 and t$¡o more exceed O.A.<br />
Although most errors appear randomly distributed in<br />
sDace, several positive errors clustered in <strong>the</strong> sou<strong>the</strong>rn part<br />
of <strong>the</strong> Inland Otago and Southland region suggest ihat<br />
some consistent underestinnation of Q has occuried <strong>the</strong>re.<br />
Table 4.7 correration malrix <strong>for</strong> rogs of North rsrand charact€rist¡cs.<br />
o<br />
AREA<br />
MARAIN<br />
t224<br />
LENGTH<br />
FOREST<br />
STMFCY*<br />
s1 085*<br />
€LEVT<br />
1.OOO<br />
o.830<br />
o.294<br />
o.2ö7<br />
o.815<br />
o.342<br />
-o.117<br />
-0.413<br />
o.247<br />
AREA MARAIN LENGTH FOREST STMFCY. S1085. ELEV'<br />
1.0O0<br />
o.040<br />
-o.110<br />
0.944<br />
0.189<br />
-o.121<br />
-o.576<br />
0.303<br />
l.OOO<br />
0.296<br />
o.o44<br />
0.506<br />
o.o69<br />
0.332<br />
0.454<br />
l.OOO<br />
-o.101<br />
o.312<br />
o.o60<br />
o.o09<br />
-0.149<br />
l.OOO<br />
0.191<br />
-o.187<br />
-0.598<br />
o.278<br />
1.000<br />
o.178 l.OOO<br />
o.o77 o.196<br />
0.348 o.157<br />
l.OOO<br />
0.348<br />
l.OOO<br />
¡ lncomplete Sample<br />
&<br />
Water & soil technical publication no. 20 (1982)


